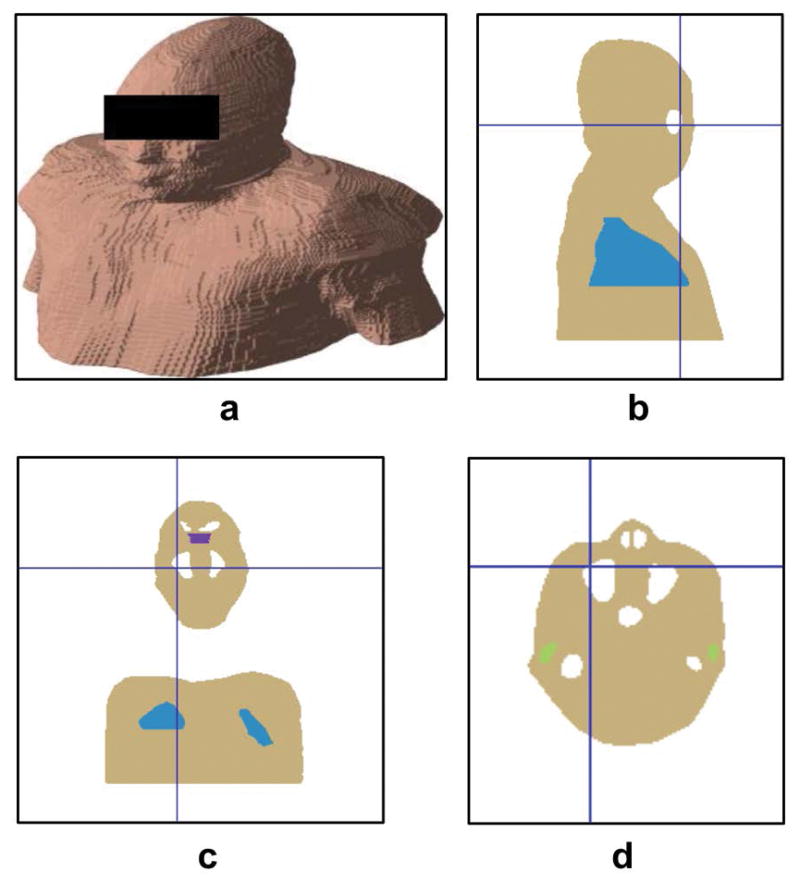
FIG. 5.

The extracted susceptibility model of subject #5 in the simulation study. a: Surface view of the model. b–d: Sagittal, coronal and axial view of the model, respectively. Blue, white, green and purple regions indicate lung, air cavity, ear canal and upper nasal pathway, respectively.
