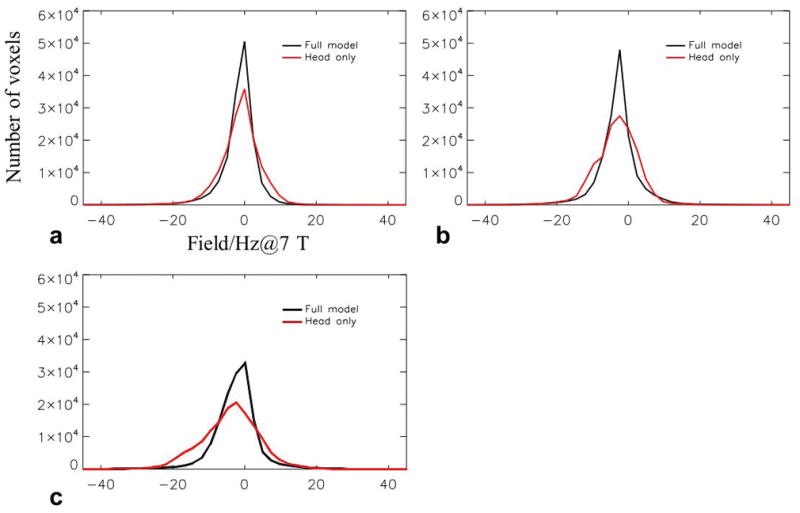
FIG. 7.

Histograms of the difference between calculated field change and experimental data for the head-only (red) and full (black) models. The head-only model shows increased error compared with the full model. a–c: Error distribution corresponding to “Right”, “Left” and “Up” poses, respectively.
