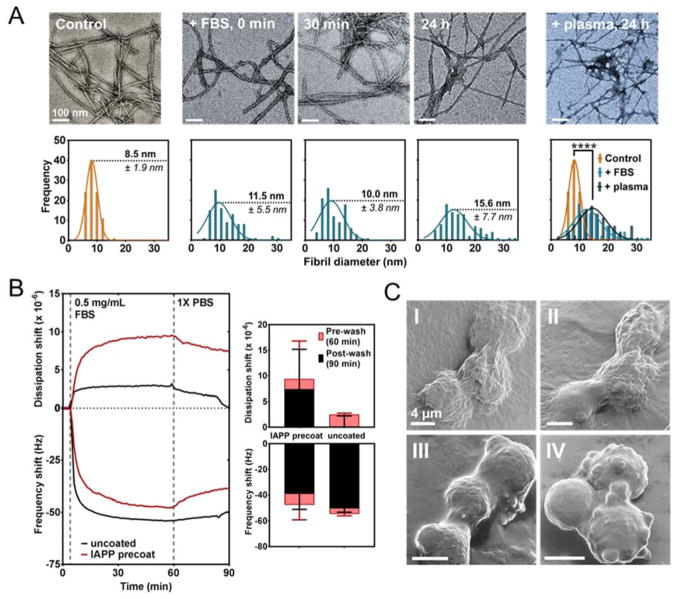
Figure 1.
Formation and characterization of IAPP amyloid-protein corona in FBS. A: TEM imaging (upper panel; scale: 100 nm) and associated analysis of fibril diameter (lower panel; n = 100 points sampled) of amyloid exposed to FBS over 24 h, with a comparative measurement after 24 h exposure to human plasma proteins. **** p < 0.0001. B: QCM characterization of amyloid corona formation on an IAPP amyloid functionalized surface (IAPP pre-coat) or gold (uncoated) under flow over 1 h (left panel) with comparison of the soft (pre-wash) and hard (post-wash) coronae (right panel). Error: SEM (n = 4). C: HIM imaging of βTC6 cells exposed for 30 min in vitro to either amyloid (I), amyloid + FBS, pre-incubated for 2 h at RT (II), FBS alone (III), or no treatment applied (IV). Scale: 4 μm. Concentration of IAPP amyloid in all experiments: 0.1 mg/mL; FBS: 0.5 mg/mL.

