
Figure 8.
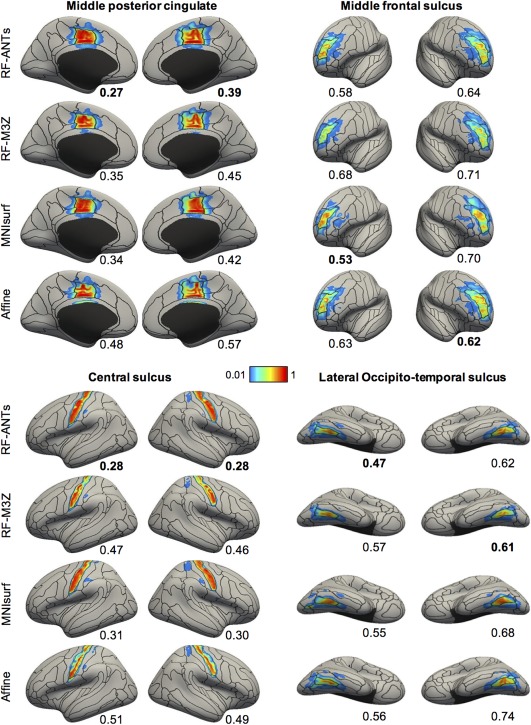
Visualization of ANTs‐derived MNI152 probabilistic maps projected to fsaverage surface space in the GSP test set. Four representative structures are shown. Black boundaries correspond to the “ground truth” winner‐takes‐all parcellation. The value below each cortical surface shows the normalized absolute difference (NAD) between projected probabilistic map and “ground truth” probabilistic map, where a smaller value indicates better performances. Best NAD for each region is bolded [Color figure can be viewed at http://wileyonlinelibrary.com]