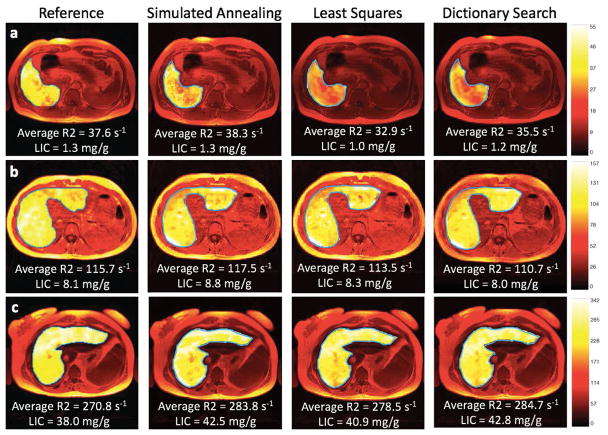
Figure 3. Liver R2 maps.
Liver R2 maps generated by the proprietary (reference) and the three nonproprietary R2-relaxometry methods (simulated annealing, least squares, dictionary search) in three representative subjects: (a) a 36-year-old man with primary hemochromatosis, (c) a 24-year-old woman with Diamond-Blackfan anemia, and (b) a 31-year-old woman with sickle cell anemia. The proprietary R2 maps subjectively appear more homogeneous than the nonproprietary R2 maps, potentially due to differences in smoothing techniques used by off-site and on-site analyses; however, the average R2 and LIC values are similar across different R2 methods. LIC = liver iron concentration, reported in mg of iron per g dry liver tissue (mg/g).

