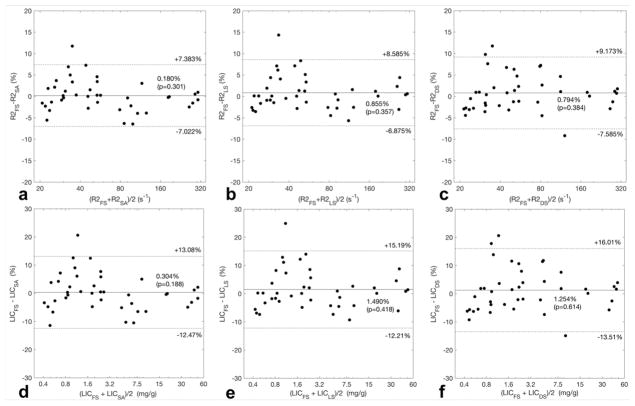
Figure 5. Bland-Altman Analysis.
Scatterplots illustrate the agreement in average liver R2 (a – c) and LIC (d – f) between the proprietary R2 method (FerriScan®) and three nonproprietary R2 methods, calculated in %-difference across the observed range in the study population. The mean %-difference is shown as the horizontal solid line, with the corresponding p-values of paired t-test; 95% limits of agreement are shown in horizontal dotted lines. A greater %-difference between the proprietary and nonproprietary methods among those with normal LIC, i.e. LIC < 1.8 mg/g (d – f), than in those with iron overload, i.e. LIC > 1.8 mg/g. R2 = average liver R2, LIC = liver iron concentration in mg/g; subscripts correspond to the R2-relaxometry method utilized to obtain the value; FS = FerriScan®, SA = simulated annealing, LS = least squares, DS = dictionary search.

