
Figure 7. Kinetics of superoxide, mitochondrial and cytosolic H2O2 in response to glucose.
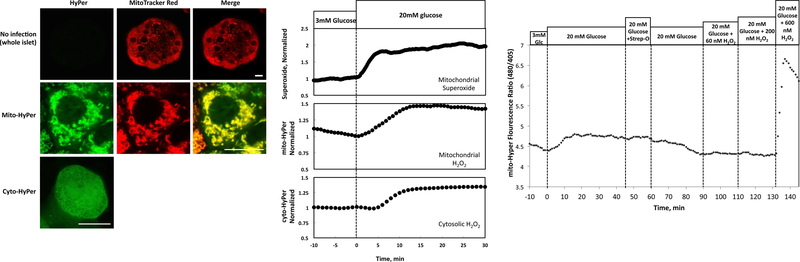
(A) Confocal imaging of islets and islet cells infected with or without mito-HyPer and cyto-HyPer. Top row of panels: images of whole islets loaded with or without MitoTracker Red. Middle row of panels: single islet cell expressing mito-HyPer and loaded with MitoTracker Red. Bottom panel: image of single islet cell expressing cyto-HyPer. White scale bar is 10 microns in length. (B) Kinetic responses of islets loaded with MitoSOX Red (a sensor for mitochondrial superoxide), or expressing mito-HyPer or cyto-HyPer (n = 4). (C) Lack of response of mito-HyPer to low levels of extracellular H2O2 in permeabilized islets (typical response).