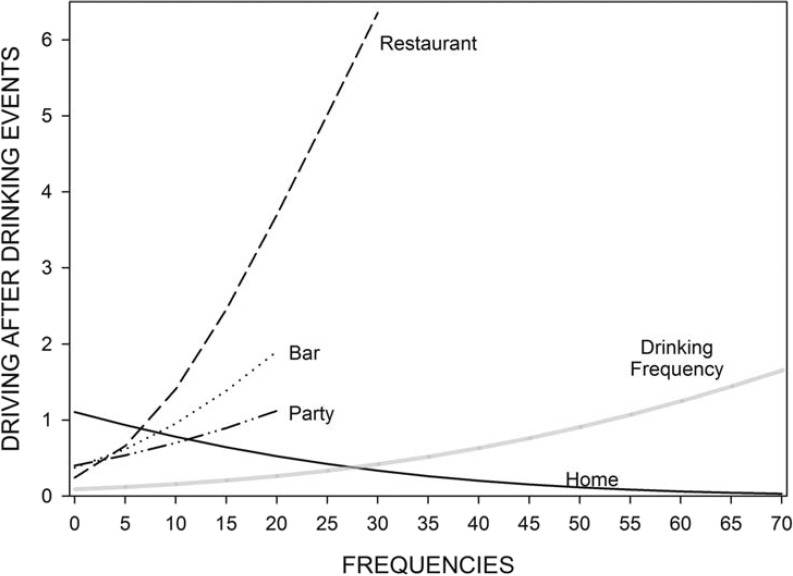
Figure 1.
Marginal contributions of drinking contexts to risks for driving after drinking (DAD). Conditional mean estimates from the censored regression model in Table 3 plotted over marginal frequencies of drinking by drinking places; each plot covers 97.5% of the frequency range for use of each place (frequencies of drinking at home ranged to 182 days and are right truncated).

