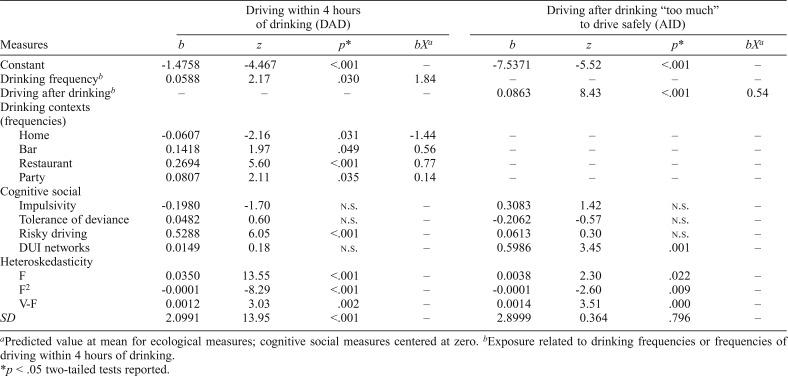
Table 3.
Heteroskedastic censored regression models of 6-month frequencies of driving within 4 hours of drinking (n = 4,650) and driving after drinking “too much” to drive safely (n = 1,892)
| Driving within 4 hours of drinking (DAD) |
Driving after drinking “too much” to drive safely (AID) |
|||||||
| Measures | b | z | p* | bXa | b | z | p* | bXa |
| Constant | -1.4758 | -4.467 | <.001 | – | -7.5371 | -5.52 | <.001 | – |
| Drinking frequencyb | 0.0588 | 2.17 | .030 | 1.84 | – | – | – | – |
| Driving after drinkingb | – | – | – | – | 0.0863 | 8.43 | <.001 | 0.54 |
| Drinking contexts (frequencies) | ||||||||
| Home | -0.0607 | -2.16 | .031 | -1.44 | – | – | – | – |
| Bar | 0.1418 | 1.97 | .049 | 0.56 | – | – | – | – |
| Restaurant | 0.2694 | 5.60 | <.001 | 0.77 | – | – | – | – |
| Party | 0.0807 | 2.11 | .035 | 0.14 | – | – | – | – |
| Cognitive social | ||||||||
| Impulsivity | -0.1980 | -1.70 | n.s. | – | 0.3083 | 1.42 | n.s. | – |
| Tolerance of deviance | 0.0482 | 0.60 | n.s. | – | -0.2062 | -0.57 | n.s. | – |
| Risky driving | 0.5288 | 6.05 | <.001 | – | 0.0613 | 0.30 | n.s. | – |
| DUI networks | 0.0149 | 0.18 | n.s. | – | 0.5986 | 3.45 | .001 | – |
| Heteroskedasticity | ||||||||
| F | 0.0350 | 13.55 | <.001 | – | 0.0038 | 2.30 | .022 | – |
| F2 | -0.0001 | -8.29 | <.001 | – | -0.0001 | -2.60 | .009 | – |
| V-F | 0.0012 | 3.03 | .002 | – | 0.0014 | 3.51 | .000 | – |
| SD | 2.0991 | 13.95 | <.001 | – | 2.8999 | 0.364 | .796 | – |
Predicted value at mean for ecological measures; cognitive social measures centered at zero.
Exposure related to drinking frequencies or frequencies of driving within 4 hours of drinking.
p < .05 two-tailed tests reported.

