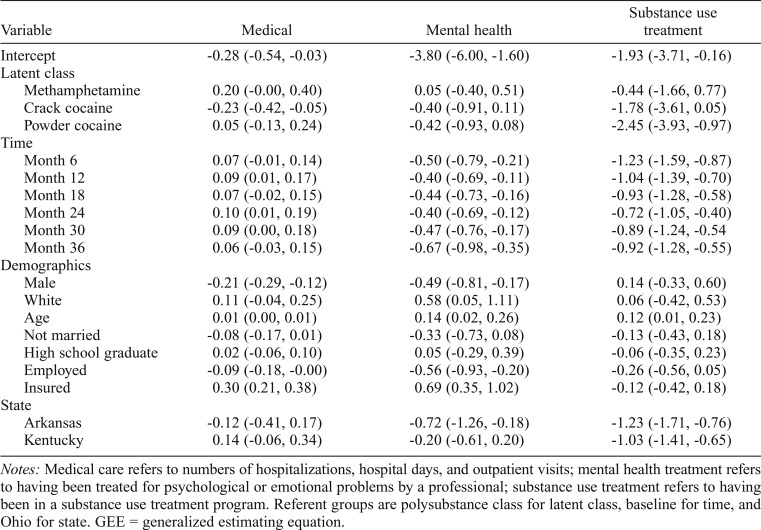
Table 4.
Parameter estimates from GEE models for medical, mental health, and substance use treatment utilization
| Variable | Medical | Mental health | Substance use treatment |
| Intercept | -0.28 (-0.54, -0.03) | -3.80 (-6.00, -1.60) | -1.93 (-3.71, -0.16) |
| Latent class | |||
| Methamphetamine | 0.20 (-0.00, 0.40) | 0.05 (-0.40, 0.51) | -0.44 (-1.66, 0.77) |
| Crack cocaine | -0.23 (-0.42, -0.05) | -0.40 (-0.91, 0.11) | -1.78 (-3.61, 0.05) |
| Powder cocaine | 0.05 (-0.13, 0.24) | -0.42 (-0.93, 0.08) | -2.45 (-3.93, -0.97) |
| Time | |||
| Month 6 | 0.07 (-0.01, 0.14) | -0.50 (-0.79, -0.21) | -1.23 (-1.59, -0.87) |
| Month 12 | 0.09 (0.01, 0.17) | -0.40 (-0.69, -0.11) | -1.04 (-1.39, -0.70) |
| Month 18 | 0.07 (-0.02, 0.15) | -0.44 (-0.73, -0.16) | -0.93 (-1.28, -0.58) |
| Month 24 | 0.10 (0.01, 0.19) | -0.40 (-0.69, -0.12) | -0.72 (-1.05, -0.40) |
| Month 30 | 0.09 (0.00, 0.18) | -0.47 (-0.76, -0.17) | -0.89 (-1.24, -0.54 |
| Month 36 | 0.06 (-0.03, 0.15) | -0.67 (-0.98, -0.35) | -0.92 (-1.28, -0.55) |
| Demographics | |||
| Male | -0.21 (-0.29, -0.12) | -0.49 (-0.81, -0.17) | 0.14 (-0.33, 0.60) |
| White | 0.11 (-0.04, 0.25) | 0.58 (0.05, 1.11) | 0.06 (-0.42, 0.53) |
| Age | 0.01 (0.00, 0.01) | 0.14 (0.02, 0.26) | 0.12 (0.01, 0.23) |
| Not married | -0.08 (-0.17, 0.01) | -0.33 (-0.73, 0.08) | -0.13 (-0.43, 0.18) |
| High school graduate | 0.02 (-0.06, 0.10) | 0.05 (-0.29, 0.39) | -0.06 (-0.35, 0.23) |
| Employed | -0.09 (-0.18, -0.00) | -0.56 (-0.93, -0.20) | -0.26 (-0.56, 0.05) |
| Insured | 0.30 (0.21, 0.38) | 0.69 (0.35, 1.02) | -0.12 (-0.42, 0.18) |
| State | |||
| Arkansas | -0.12 (-0.41, 0.17) | -0.72 (-1.26, -0.18) | -1.23 (-1.71, -0.76) |
| Kentucky | 0.14 (-0.06, 0.34) | -0.20 (-0.61, 0.20) | -1.03 (-1.41, -0.65) |
Notes: Medical care refers to numbers of hospitalizations, hospital days, and outpatient visits; mental health treatment refers to having been treated for psychological or emotional problems by a professional; substance use treatment refers to having been in a substance use treatment program. Referent groups are polysubstance class for latent class, baseline for time, and Ohio for state. GEE = generalized estimating equation.

