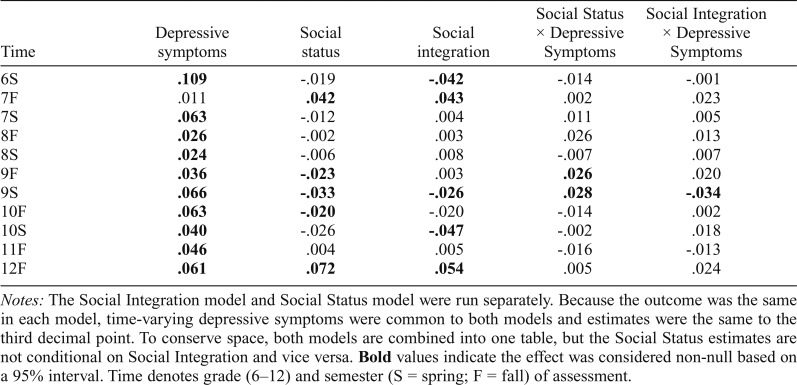
Table 4.
Standardized effect sizes: Time-varying interactions predicting time-specific elevations in adolescent substance use
| Time | Depressive symptoms | Social status | Social integration | Social Status × Depressive Symptoms | Social Integration × Depressive Symptoms |
| 6S | .109 | -.019 | -.042 | -.014 | -.001 |
| 7F | .011 | .042 | .043 | .002 | .023 |
| 7S | .063 | -.012 | .004 | .011 | .005 |
| 8F | .026 | -.002 | .003 | .026 | .013 |
| 8S | .024 | -.006 | .008 | -.007 | .007 |
| 9F | .036 | -.023 | .003 | .026 | .020 |
| 9S | .066 | -.033 | -.026 | .028 | -.034 |
| 10F | .063 | -.020 | -.020 | -.014 | .002 |
| 10S | .040 | -.026 | -.047 | -.002 | .018 |
| 11F | .046 | .004 | .005 | -.016 | -.013 |
| 12F | .061 | .072 | .054 | .005 | .024 |
Notes: The Social Integration model and Social Status model were run separately. Because the outcome was the same in each model, time-varying depressive symptoms were common to both models and estimates were the same to the third decimal point. To conserve space, both models are combined into one table, but the Social Status estimates are not conditional on Social Integration and vice versa. Bold values indicate the effect was considered non-null based on a 95% interval. Time denotes grade (6–12) and semester (S = spring; F = fall) of assessment.

