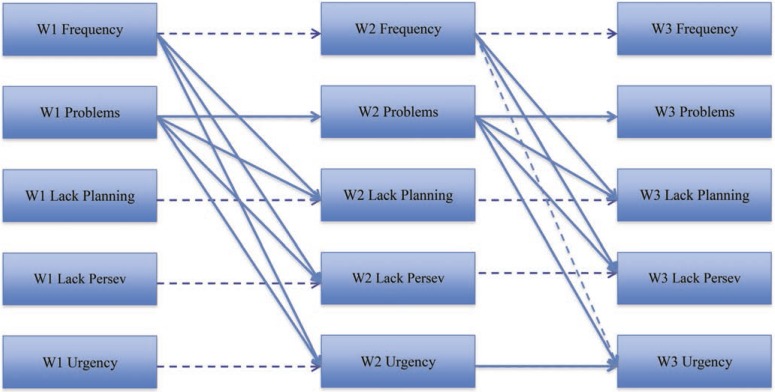
Figure 2.
Random intercept cross-lagged panel analysis results. Note: n = 458. Dashed lines represent nonsignificant pathways; solid lines represent significant pathways. All pathways from personality variables to drinking variables were included in the model but not significant; those nonsignificant pathways were not included in increase readability of the model. Beta weight coefficients are presented for significant pathways in Table 3.

