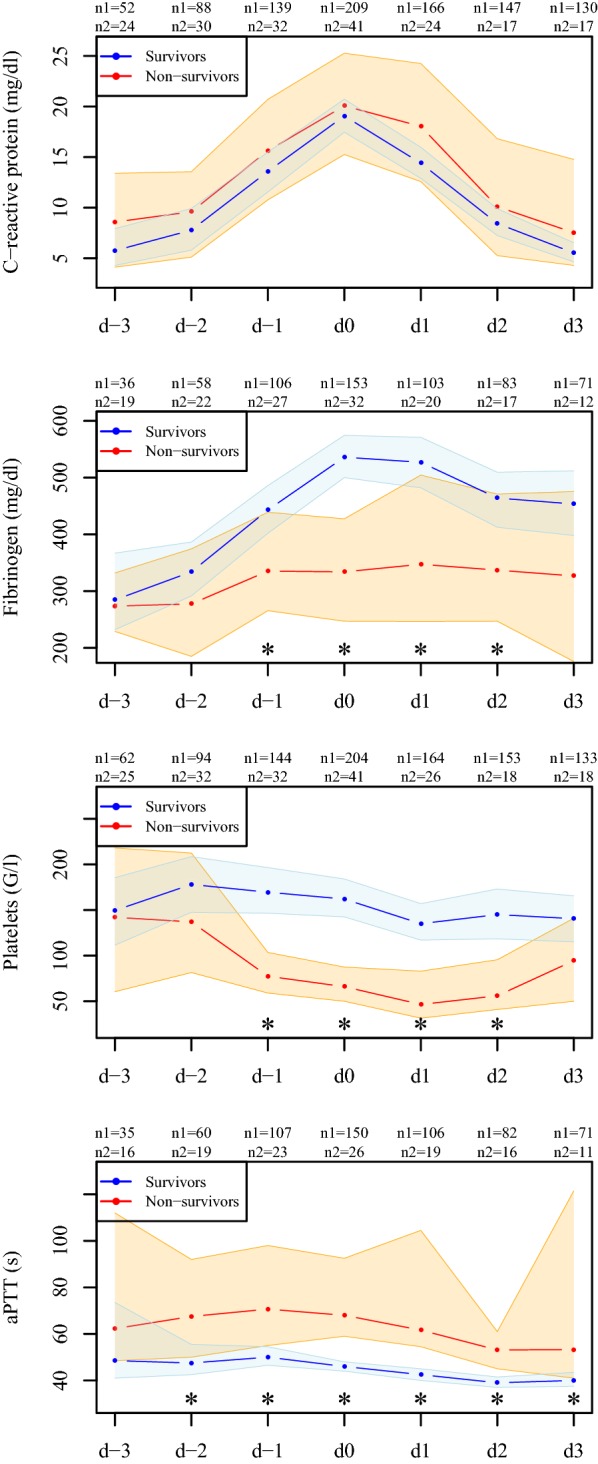
Fig. 1.

Progression of C-reactive protein and measured coagulation parameters. Depicted are medians with 95% CIs of the measured parameters for survivors (blue) and non-survivors (red) from 3 days prior to (d-3 to d-1) until 3 days after (d1 to d3) C-reactive protein peaked (d0). Asterisks indicate significant differences between survivors and non-survivors at the respective time point; n1 is the number of available measurements for survivors and n2 for non-survivors
