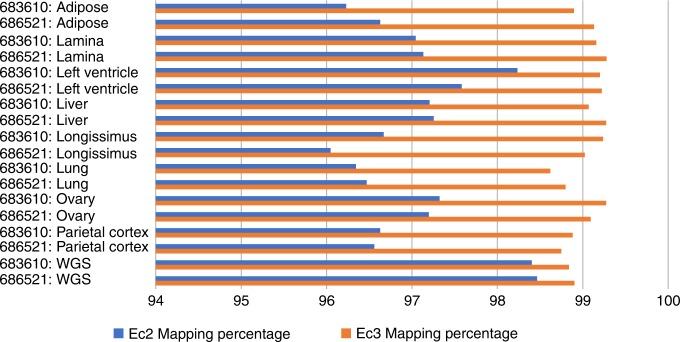
Fig. 1.
Percentages of RNA-seq reads from eight tissues from two horses (designated 683610 and 686521) and genomic reads mapping to EquCab2 vs. EquCab3. We used sequence data from the Functional Annotation of Animal Genomes (FAANG) project for this mapping. More RNA-seq reads map to EquCab3 than to EquCab2 for every tissue in both horses. The percentage of genomic reads (last two rows; WGS) mapping to EquCab3 is also larger than those mapping to EquCab2, but the difference is not as large

