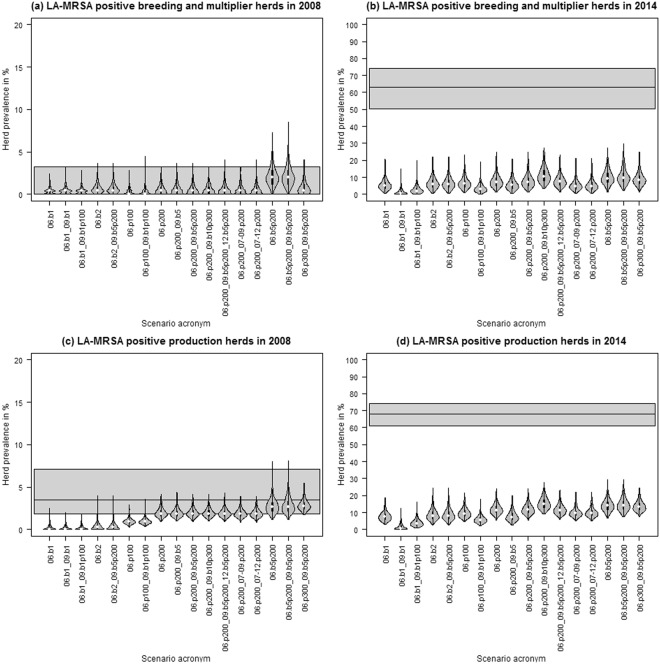
Figure 3.
Herd prevalence in breeding and multiplier herds (a,b) and production herds (c,d) on 31st December 2008 and 31st December 2014 resulting from simulated LA-MRSA transmission via pig movements only, based on 500 iterations. Time-shifted transmission rates adapted from Broens et al.28 were used. The horizontal black line and grey area mark the observed prevalence and 95% confidence interval of the LA-MRSA screenings performed in Danish swine herds in 2008 and 2014. Example acronyms: 06.b5p200 – initialisation in five breeding and multiplier herds and 200 production herds in 2006, 06.b5_07-09.p200 – initialisation in five breeding and multiplier herds in 2006 and 200 production herds each year from 2007 to 2009.

