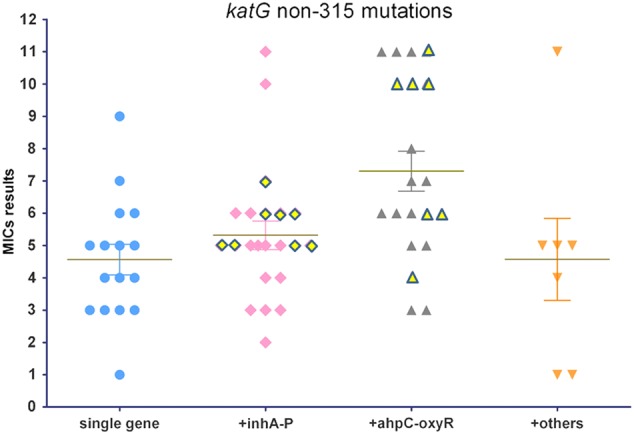
Fig. 2. MIC results for INH-resistant isolates with katG non-315 mutations.

The horizontal axis shows four groups of isolates with single gene mutations and different combinations of multiple gene mutations. MIC results are represented by numbers from 1 to 11 on the vertical axis, corresponding to 11 double diluted concentrations of INH, ranging from 0.1 to 102.4 mg/L. The yellow diamond and triangle shapes with outskirts refer to the MIC results from isolates with three or four simultaneous gene mutations involved in the less frequent gene loci
