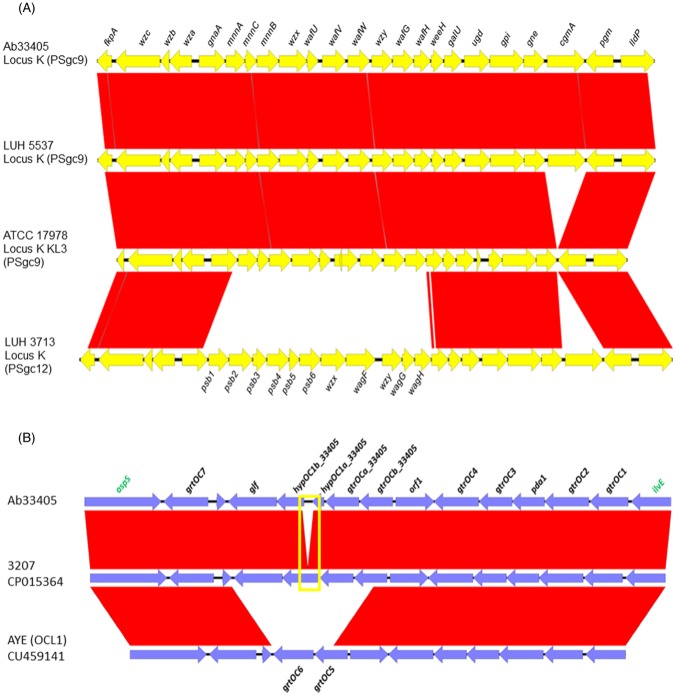
Figure 3.
Comparison and genetic structure of K locus and OC locus of A. baumannii Ab33405 strain. (A) The K locus genes is indicated in black and flanked genes are indicated in green. (B) The OC locus is indicated in black and flanked genes are indicated in green. Both locus structure, K and O, were compared to the most similar structures present in the GenBank databases. The yellow square indicates the 226-nucleotide difference between Ab33405 and 3207 strains. The graphic representation was made using the EasyFig. 2.2.2 software.

