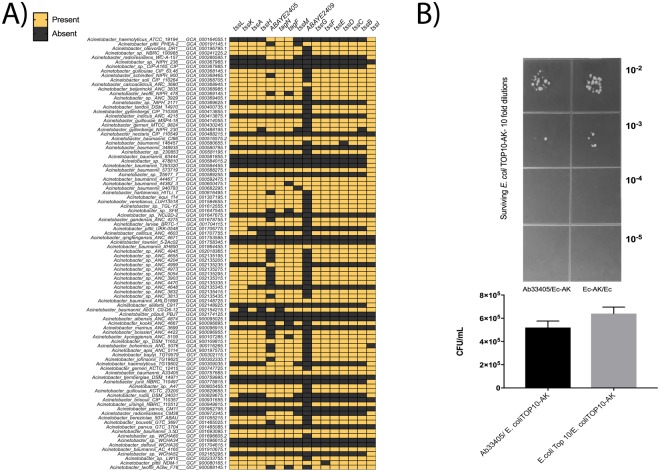
Figure 5.
Genomic comparison of genes coding for T6SS system. (A) Distribution of the T6SS components in Acinetobacter. Each component of the T6SS was mapped on the 96 sampled genomes, representatives of the diversity of the genus. Genes were searched by means of BLASTP, using a maximum e-value of 1e-5, a minimum identity value of 50%, and query coverage of 75% as threshold. The genes of A. baumannii AYE were used as query in all cases, as defined in Weber et al. 2013. Orange boxes show presence and gray boxes show absence of T6SS genes. The heatmap was generated using GraphPad Prism version 7 (B) Bacterial Killing assay using E. coli TOP10-AK (Prey) and Ab33405 (Predator). Representative LB-AK agar plate showed differences in survival of bacterial colonies. The experiment was performed two times.

