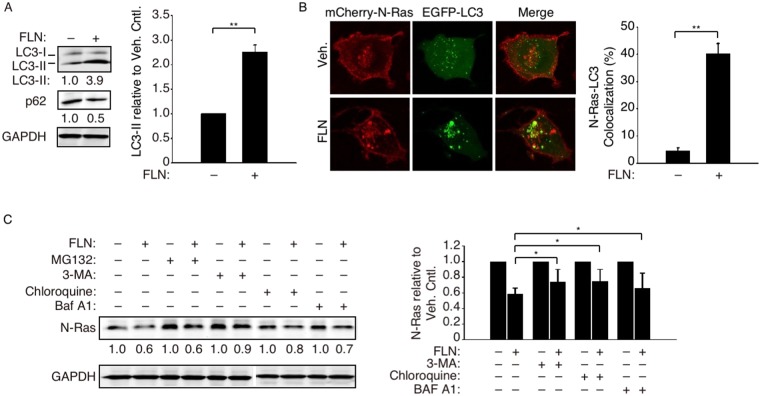
Figure 2.
FLN enhanced autophagic influx and N-Ras translocation to autophagosomes. (A) Left, Western blot analysis of LC3-II and p62/SQSTM-1 in SUM149PT cells treated with 20 µM FLN for 24 h. Numbers below show protein levels relative to that in the vehicle control cells. Right, quantification of relative LC3-II levels from three independent experiments. (B) Cells co-transfected with mCherry-N-Ras and EGFP-LC3 were imaged by confocal microscopy after FLN treatment (left). Percent co-localization (see Methods) was quantified on the right (n = 6 cells). (C) Left, SUM149PT cells were first treated with FLN as in panel-A, followed by autophagy inhibitors 3-MA (5 mM), chloroquine (20 µM) or bafilomycin A1 (20 nM) for another 24 hours. The proteasome inhibitor MG132 (15 µM) was included as a negative control to show unabated N-Ras reduction. The cells were then harvested and analyzed by Western blot. The numbers show N-Ras levels relative to those in cells not treated by FLN. Data from three independent experiments were quantified on the right.

