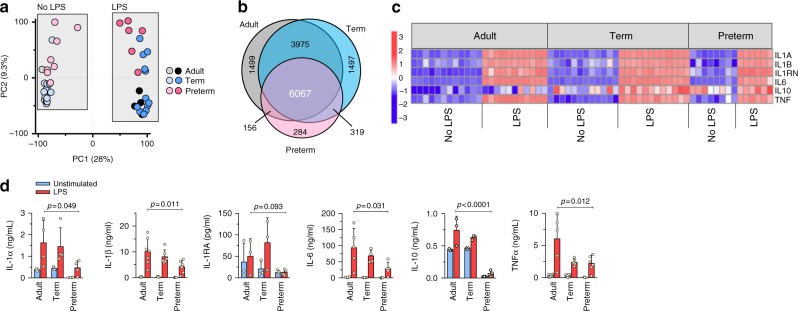
Fig. 4.
Transcriptome and cytokine responses to LPS in neonatal monocytes. a Principal component (PC) analysis of unstimulated versus LPS-stimulated monocytes and b Venn diagram of differentially expressed genes (LPS-stimulated samples) overlapping between age groups (FDR 5%). c Expression heatmap of cytokine genes (5 h LPS; scale = z-score) Data from same subjects as in Fig. 3, except for 1 adult and 2 preterm subjects with insufficient cells for LPS condition; d Production of cytokines following LPS stimulation (24 h, mononuclear cells) by ELISA (effect of age by two-way ANOVA; mean ± SD; n = 3 to 6 subjects per age group)

