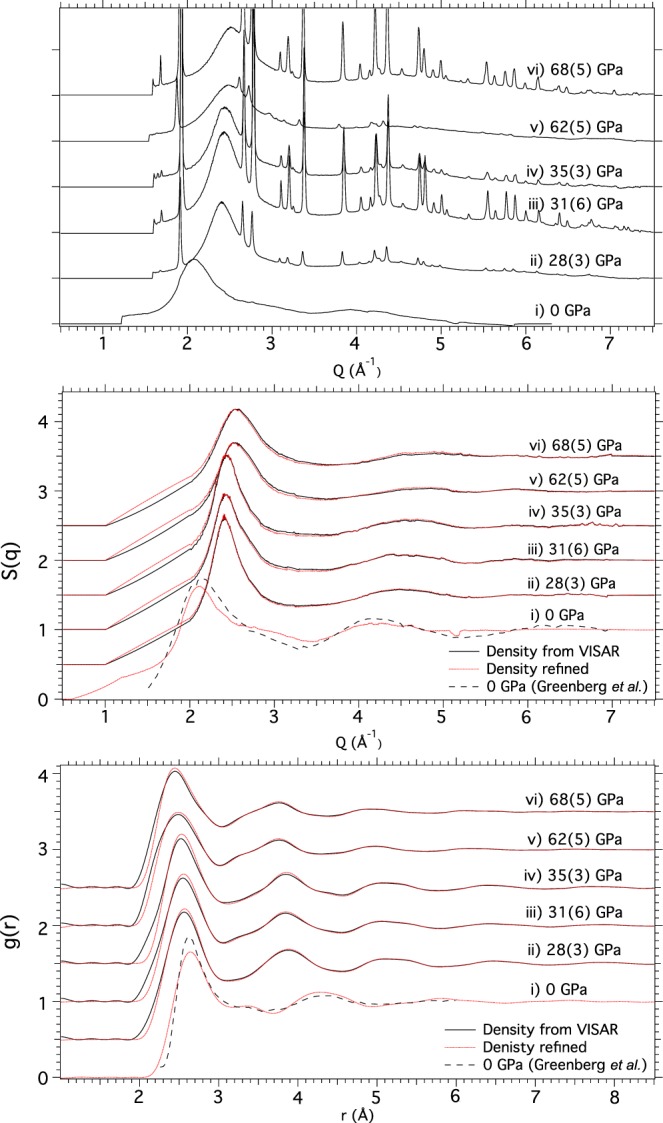
Figure 3.

Local Structure of Liquid-Bi on Shock Compression (profiles spaced in intensity for clarity). (a) Integrated diffraction profiles from liquid-Bi from 28–68 GPa (profiles (ii–vi)), and also at 0 GPa and ~1500 K (profile (i)). (b) The corresponding S(Q) data. The prominent shoulder on the high-Q side of the first liquid peak at 0 GPa suggest that the local structure of liquid-Bi at this pressure deviates from that of a simple liquid. At higher pressures (profiles (ii–vi)) this shoulder is not observed, demonstrating that liquid-Bi is more simple and close-packed at these pressures. (c) The corresponding g(r) data. The form of g(r) changes as a shoulder on the left-hand side of the second coordination maximum becomes more prominent with increasing pressure, indicating liquid-Bi goes through a subtle and smooth transition with pressure. The full and dotted profiles in (b,c) show the S(q) and g(r) results obtained using sample densities determined using two different methods. The ambient pressure S(q) and g(r) from Greenberg et al. are shown by dashed line in (b)(i) and (c)(i) for comparison23.
