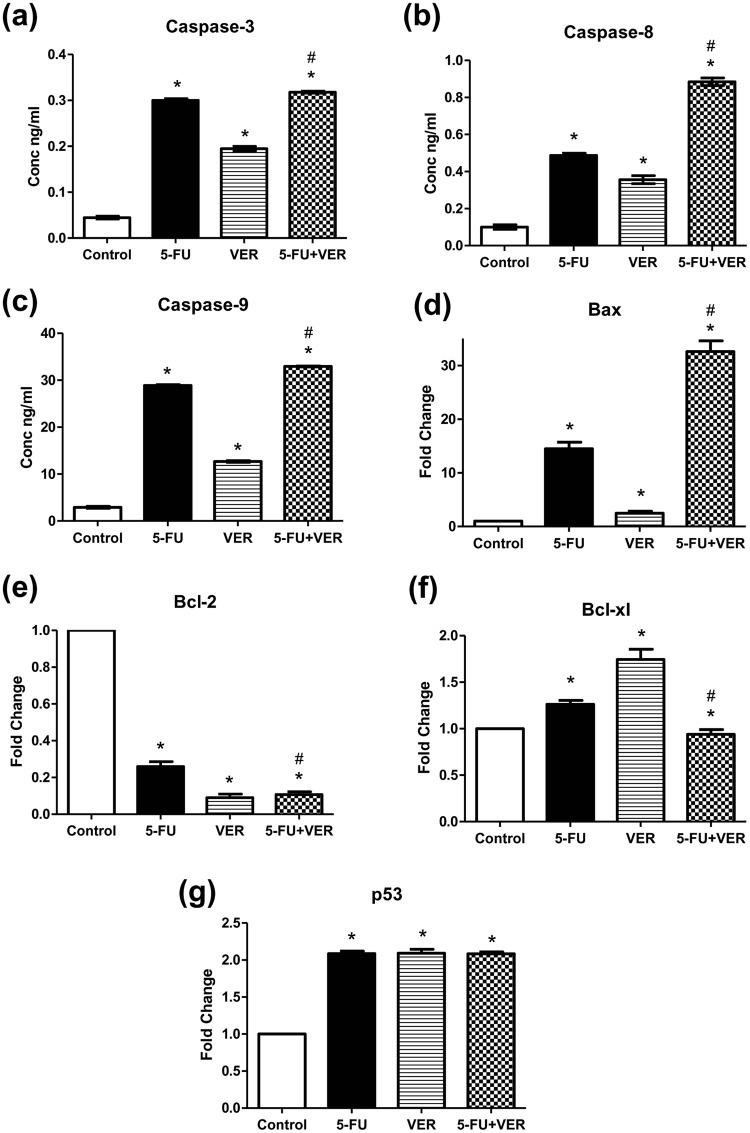
Figure 6.
Effect of 5-FU and VER, alone and combined, on (a) caspase-3, (b) caspase-8, and (c) caspase-9 protein levels as well as (d) Bax, (e) Bcl-2, (f) Bcl-xL, & (g) p53 gene expression. Protein levels were estimated using ELISA. Gene expression levels were estimated using relative qRT-PCR method (fold change from control untreated samples normalized to GAPDH). Values are presented as means ± S.D. from three independent experiments performed in triplicates. *P < 0.05 significant from control untreated cells, #P < 0.05 significant from 5-FU-treated cells using one way ANOVA followed by Bonferroni post hoc test.

