Fig. 1.
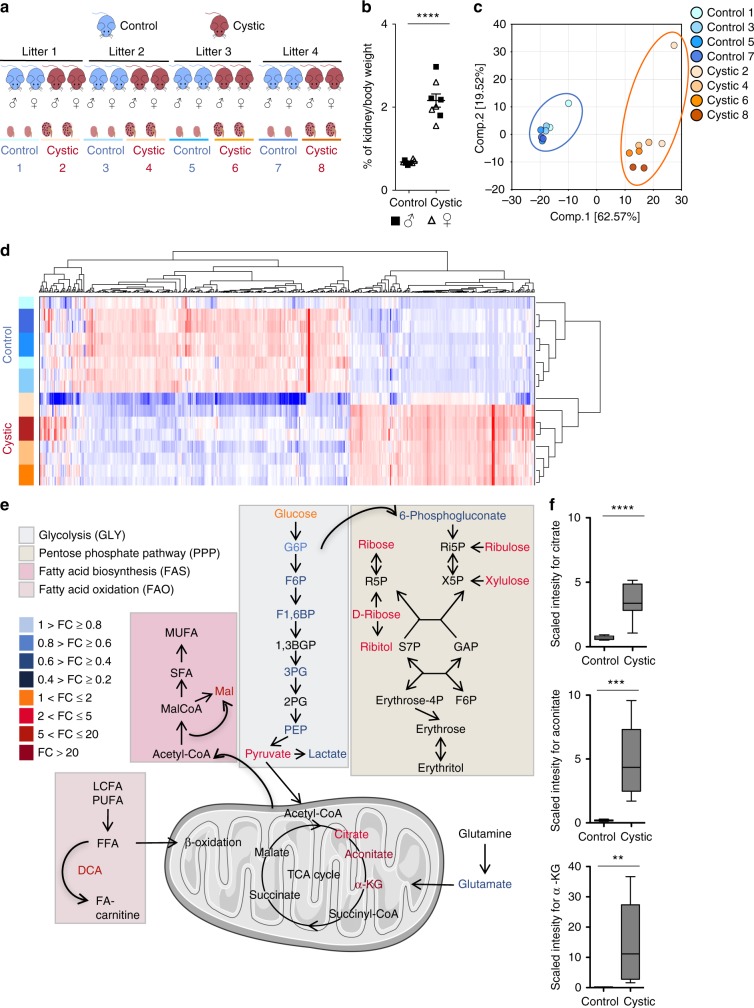
Global metabolomic profiling reveals defective TCA cycle in polycystic kidneys. a Study design of the experiment performed on kidneys from Ksp-cre;Pkd1flox/− at P4. 4 litters each containing 2 cystic (red) Ksp-cre;Pkd1flox/− and 2 control littermates Ksp-Cre;Pkd1flox/+ or Pkd1flox/+ (blue, used interchangeably) were collected. Samples were processed for analysis by Ultrahigh Performance Liquid Chromatography–Tandem Mass Spectrometry. b Dot plot view showing percentage of kidney/body weight in the cystic and control kidneys. c PCA applied to the identified metabolites, shows a good separation between cystic versus control kidneys. d Hierarchical clustering analysis shows good clustering between the groups of cystic and control kidneys samples. e Significant metabolites were colour-coded according to the pathway classification. Scheme of the Glycolysis (GLY), Pentose Phosphate Pathway (PPP), Tricarboxylic acid (TCA) cycle, Fatty acid biosynthesis (FAS), Fatty acids oxidation (FAO) in cystic versus control kidneys. Colour corresponds to the fold changes between cystic and control kidneys, orange-red are metabolites more abundant in cystic compared to the control kidneys, whereas blue labelled ones correspond to the less abundant metabolites in cystic kidneys compared to controls. The figure contains modified elements from Servier Medical Art (http://smart.servier.com/). All abbreviations are in Supplementary Table 2. f Box and whiskers view of the levels of TCA intermediates citrate, aconitate, and α-KG were assessed by LC-MS, they were significantly more abundant in cystic compared to the control kidneys. n = 8 independent biological replicates. Dot blots are shown as mean and error bars as SEM; Box and whiskers show median and 2.5-97.5 percentiles, n.s. not significant (P ≥ 0.05), *P < 0.05; **P < 0.01; ***P < 0.001; ****P < 0.0001, t-test for b, e, and f

