Fig. 2.
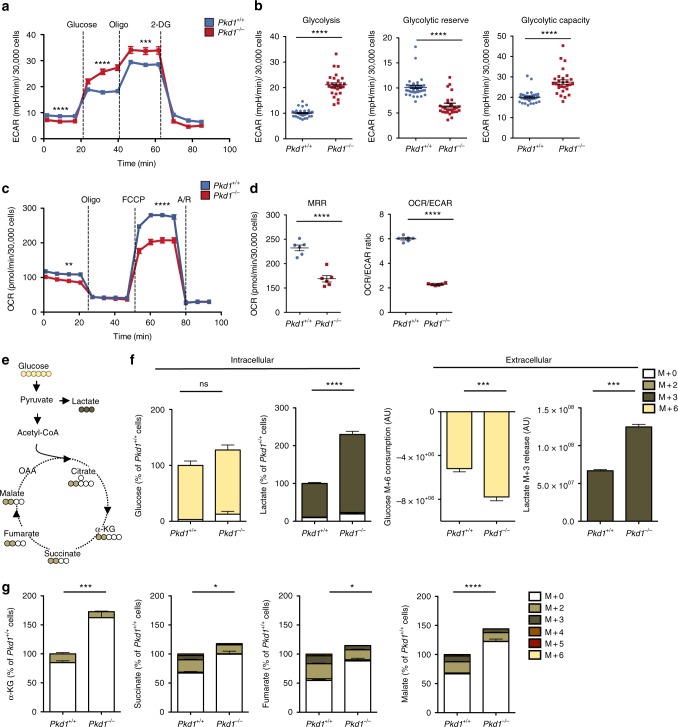
Impaired respiration and usage of glucose in the TCA cycle in Pkd1−/− cells. a, b Representative analysis of ECAR outputs of Pkd1−/− compared to Pkd1+/+ cells subject to glycolysis tests in response to glucose, oligomycin and 2-DG, b dot plots showing means with 28 to 39 replicate wells per group for glycolysis, glycolytic capaticity, and glycolytic reserve. Glycolysis was calculated on the 6th measurement time (after substraction of 3rd measurement); the glycolytic reserve was measured on the 9th measurement time (after substraction of 6th measurement); the glycolytic capacity was calculated on the 9th measurement time (after substraction of the 3rd measurement). c, d Representative analysis of OCR measurement in Pkd1+/+ and Pkd1−/− cells in basal conditions and after sequential addition of oligomycin, FCCP and antimycin/rotenone (A/R). d Dot plots showing means with 6 replicate wells per group for: MRR calculated from the 10th measurement (after subtraction of the 13th measurement); OCR/ECAR ratio from basal measurement, 2nd time point. a–d Representative of three independent experiments. e The scheme illustrates the fate of glucose C atoms in glycolysis and Krebs cycle intermediates. Cells were incubated in glucose-free DMEM supplemented with 25 mM 13C6-glucose for 24 h. The uniformly labelled glucose (M + 6 yellow) leads to formation of M + 3 lactate (dark brown) or M + 2 TCA cycle intermediates after its first round (M + 2 light brown). f Percentage of isotopologue distribution of intracellular and extracellular glucose and lactate shows that glucose (M + 6) is more consumed and more converted into lactate (M + 3) in Pkd1−/− cells in comparison to control cells (see Methods for calculations). g Percentage of isotopologue distribution of intracellular intermediates of the TCA: total α-KG, succinate, fumarate, and malate shows that the molecules coming from glucose (M + 2) are decreased in Pkd1−/− MEFs compared to the control cells. Graphs (f, g) are means in percentages relative to control cells of six technical replicates from one experiment. Mean ± SEM were indicated, statistical significance is provided for total pool. n.s. not significant (P ≥ 0.05), *P < 0.05; **P < 0.01; ***P < 0.001; ****P < 0.0001, t-test

