Fig. 3.
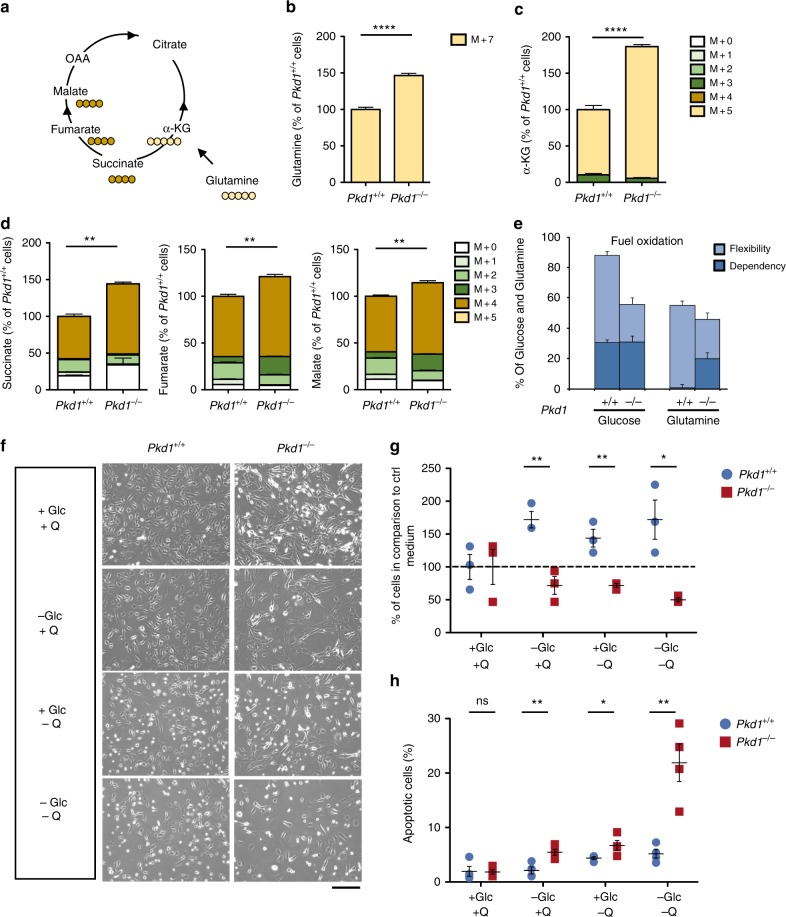
Metabolic rearrangement in bioenergetics pathways and glutaminolysis rewiring in Pkd1-/- cells. a The scheme illustrates the fate of glutamine C atoms in Krebs cycle intermediates (Oxidative). Cells were incubated in glutamine-free DMEM supplemented with 4 mM 13C5–15N2 glutamine for 24 h. b Quantification of the intracellular labelled 13C5–15N2 glutamine (M+7) showing that Pkd1−/− cells have a higher uptake compared to the controls. c Isotopologue distribution of intracellular α-KG shows that pools containing five 13C (M + 5), coming from labelled glutamine, were all significantly higher in Pkd1−/− as compared with Pkd1+/+ cells. d Isotopologue distribution of intracellular succinate, fumarate, and malate shows that pools containing four 13C (M + 4), coming from labelled glutamine, were all significantly higher in Pkd1−/− as compared with Pkd1+/+ cells. Graphs are means in percentages relative to control cells of six technical replicates from one experiment. statistical significance is provided for total pool. e Representative graph showing the results in percentage of the XFMitoFuel Flex Test analysis measuring OCR in response to either glucose or glutamine from at least seven technical replicates per well of two independent experiments. Data show a reduced oxidation of glucose in Pkd1−/− cells and an increased dependency on glutamine compared to wild-type cells. f Cells were grown under starvation from either glucose or glutamine or both in 10% serum for 24 and 48 h after an overnight 0.5% serum. Representative images showing the cellular morphology of Pkd1−/− compared to Pkd1+/+cells in starved and non-starved conditions. g Viability of Pkd1+/+ and Pkd1−/− cells, expressed as percentage cell count compared to time 0, after 24 h of incubation in starvation from glucose, glutamine, or both. h Percentage of apoptotic cells assayed by TUNEL assay, showing significant higher percentage of apototic cells in starvation. Graphs (f–h) are representative of at least three independent experiments, data are means from at least three technical replicates. Mean ± SEM were indicated, n.s. not significant (P ≥ 0.05), *P < 0.05; **P < 0.01; ***P < 0.001; ****P < 0.0001. t-test (b, c, and d) and (g and h, comparison between each condition)

