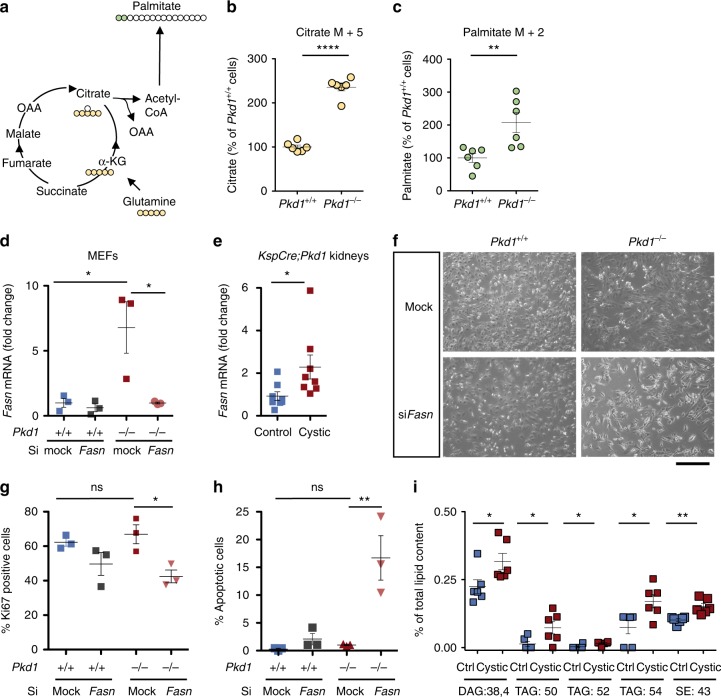
Fig. 5.
Glutaminolysis and fatty acids synthase dependence of Pkd1−/− cells. a The scheme illustrates the fate of glutamine C atoms in TCA cycle intermediates and fatty acid biosynthesis. b Quantification of intracellular citrate (M + 5) labelled by glutamine was significantly higher in Pkd1−/− as compared with Pkd1+/+ cells. c Incorporation of glutamine carbons into intracellular palmitate (M + 2) was significantly higher in Pkd1−/− as compared with Pkd1+/+ cells. Data are means from six technical replicates from one experiment. d Dot plots showing means fold change, SEM, mRNA levels of Fasn in Pkd1−/− compared to mock Pkd1+/+ cells and SiFasnPkd1−/− compared to mock Pkd1−/− normalized to Hprt. Three technical replicates of at least 3 independent experiments. e Dot plots showing means fold change, SEM, mRNA Fasn levels measured in control compared to cystic kidneys normalized to Hprt. n = 8, two technical replicates of at least two independent experiments. f Representative images showing cellular morphology of siFasn in Pkd1+/+ and Pkd1−/− and mock controls. g Representative graph of percentage Ki67-positive cells for mock and SiFasn for Pkd1+/+ and Pkd1−/− cells after 48 h of transient silencing. Data from three technical replicates of at least two independent experiments. h Representative graphs showing percentage of apoptotic cells after 48 h of transfection, data from three technical replicates from three independent experiments. i Lipidomic profiling of cystic versus control kidneys showed altered percentage of diacylglycerol (DAG:38.4), three different species of triacylglycerol (TAG:50, TAG:52 TAG:54) and sterol esters (SE:43) from total lipid content, n = 6. Scale bar is 100 μm. Mean ± SEM were indicated, n.s. not significant (p ≥ 0.05), *P < 0.05; **P < 0.01; ***P < 0.001; ****P < 0.0001. t-test for b, c, ANOVA followed by Bonferroni for d, e, g, and h ANOVA for i

