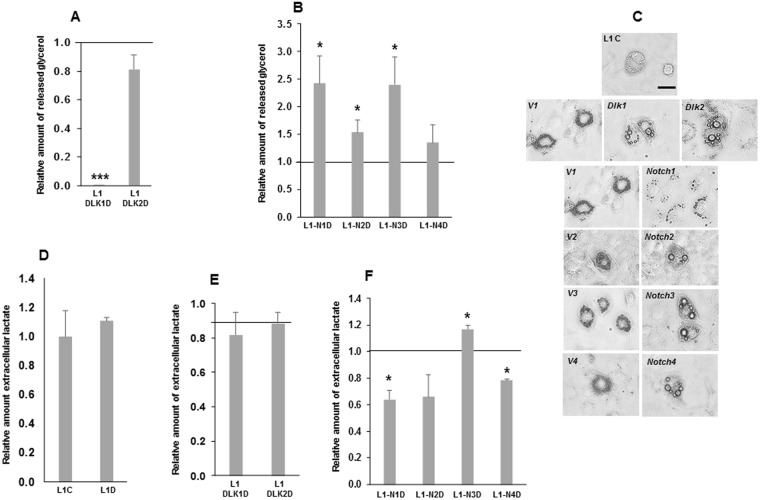
Figure 4.
Release of glycerol and lactate to the extracellular medium in 3T3-L1 adipocytes over-expressing Dlk or Notch genes. Relative levels of glycerol released to the extracellular medium in response to isoproterenol from Dlk1 or Dlk2 genes (A), and Notch1, 2, 3 or 4 genes (B) over-expressing adipocytes. (C) Representative microscopy images (400X magnification) of non-transfected (L1C) and transfected 3T3-L1 adipocytes (Empty vectors V1, V2, V3 and V4, and their corresponding over-expressing transfectant) under study. The size of their lipid droplets is showed. Scale bar (80 μm) is shown. Relative levels of lactate in the culture supernatant of differentiated non-transfected 3T3-L1 cells (D), Dlk1 or Dlk2 genes over-expressing adipocytes (E), and each of the Notch genes over-expressing adipocytes (F). The fold activation or inhibition was calculated relative to the seven-day differentiated non-transfected or empty-vector-transfected cells, which was set arbitrarily at 1. Data are shown as the mean ± SD of at least three biological assays performed in triplicate. The statistical significance calculated by Student’s t-tests is indicated (*p ≤ 0.05, **p ≤ 0.01, ***p ≤ 0.001).

