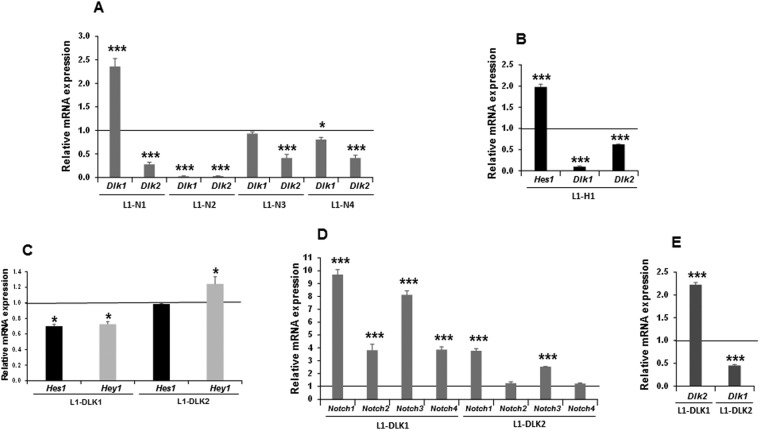
Figure 8.
Feedback modulation among Notch and Dlk gene expression in 3T3-L1 preadipocytes. (A) qRT-PCR analysis of the relative individual Dlk (B) mRNA expression levels in the stable Notch1 gene transfectant (L1-N1), the stable Notch2 gene transfectant (L1-N2), the stable Notch3 gene transfectant (L1-N3), and the stable Notch4 gene transfectant (L1-N4). (B) qRT-PCR analysis of the relative Hes1 and Dlk mRNA expression levels in the stable Hes1 gene transfectant (L1-H1). (C) qRT-PCR analysis of the relative Hes1 and Hey1 mRNA expression levels in the stable Dlk1 gene transfectant (L1-DLK1) and the stable Dlk2 gene transfectant (L1-DLK2). qRT-PCR analysis of the relative Notch (D) and Dlk (E) mRNA expression levels in the stable Dlk1 gene transfectant (L1-DLK1), and the stable Dlk2 gene transfectant (L1-DLK2). In all qRT-PCR assays, data were normalized to P0 mRNA expression levels. The fold activation or inhibition in all assays was measured relative to the empty vector, set arbitrarily at 1. Data are shown as the mean ± SD of at least three biological assays performed in triplicate. The statistical significance of Student’s t-tests results is indicated (*p ≤ 0.05, **p ≤ 0.01, ***p ≤ 0.001).

