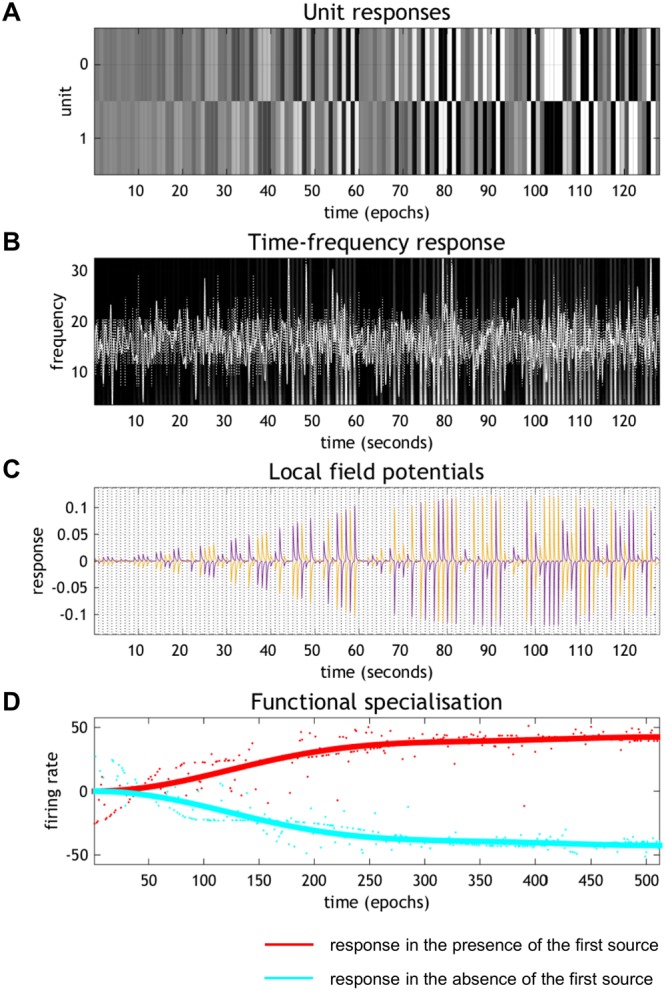
Figure 5.

Synthetic responses of the simulated Bayes optimal encoder. (A) Simulated firing rates for the first 128 epochs, focusing on units encoding the absence (top) and presence (bottom) of the first source. (B) The equivalent responses averaged over all neurons after band-pass filtering (white lines). These simulated local field potentials are shown on a background image of induced responses following a time frequency analysis (see30 for details). (C) A more detailed representation of the simulated local field potentials of the units shown in panel (A). These field potentials are the band-pass filtered firing rates of the unit encoding the posterior expectation of one source (purple line) and its absence (yellow line). (D) The resulting emergence of selective responses, plotted in the same format used in Fig. 3, where red and cyan lines express responses in the presence and absence of the first source, respectively.
