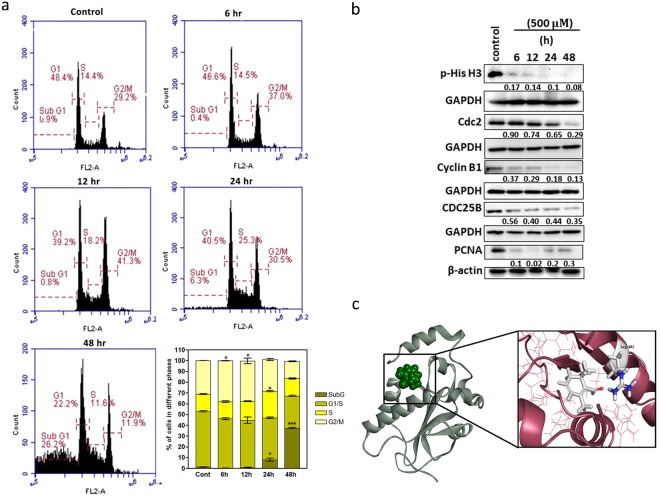
Figure 2.
Safranal arrests HepG2 cells at G2/M and S Phase and affects cell cycle regulators. (a) Cell cycle progression of HepG2 cells after treatment with safranal at a dose of 500 µM over a period of 48 h; and quantitative distribution of HepG2 cells in different phases of the cell cycle at different time intervals. Statistical analysis was carried out by student’s t-test using GraphPad Prism software and p < 0.05 was considered as statistically significant. *p < 0.05 and ***p < 0.01 (b). Western blot analysis of cell cycle regulatory proteins in HepG2 cells post treatment with safranal at a dose of 500 µM. Each band intensity was quantified using ImageJ, normalized relative to their respective loading control bands. Values are expressed as ratio of untreated control. Western blot images (b) have been cropped for clarity with full blots presented in Supplementary Fig. 1. (c) Best docked poses of safranal within the human CDC25B binding site.

