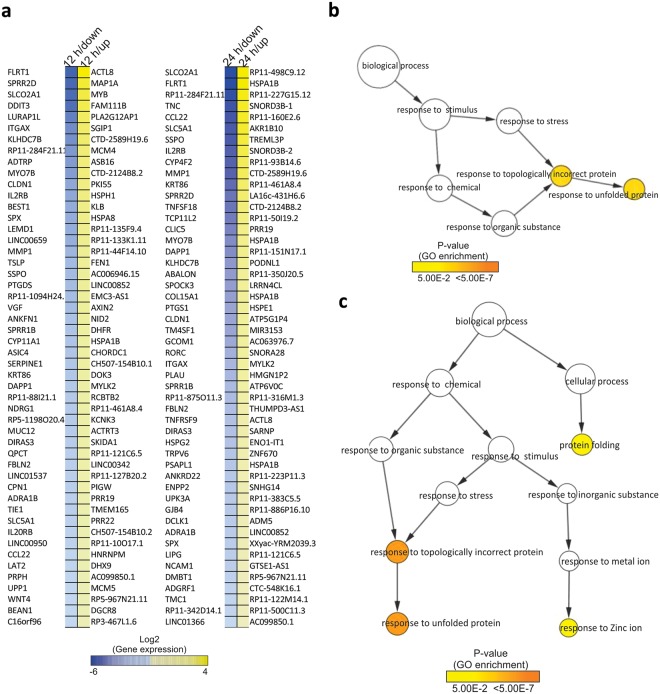
Figure 6.
(a) Heatmaps of the top 50 differentially expressed genes. The heatmaps display the log2 fold change of the top 50 genes (up and downregulated) at 12 and 24 h after treatment. (b) GO term overrepresentation of the top up-regulated 100 genes at 12 h. (c) GO term overrepresentation of the top up-regulated 100 genes at 24 h. The size of each circle is correlated to the number of genes and the color of the nodes indicates different levels of significance for the enriched terms according to the provided key.

