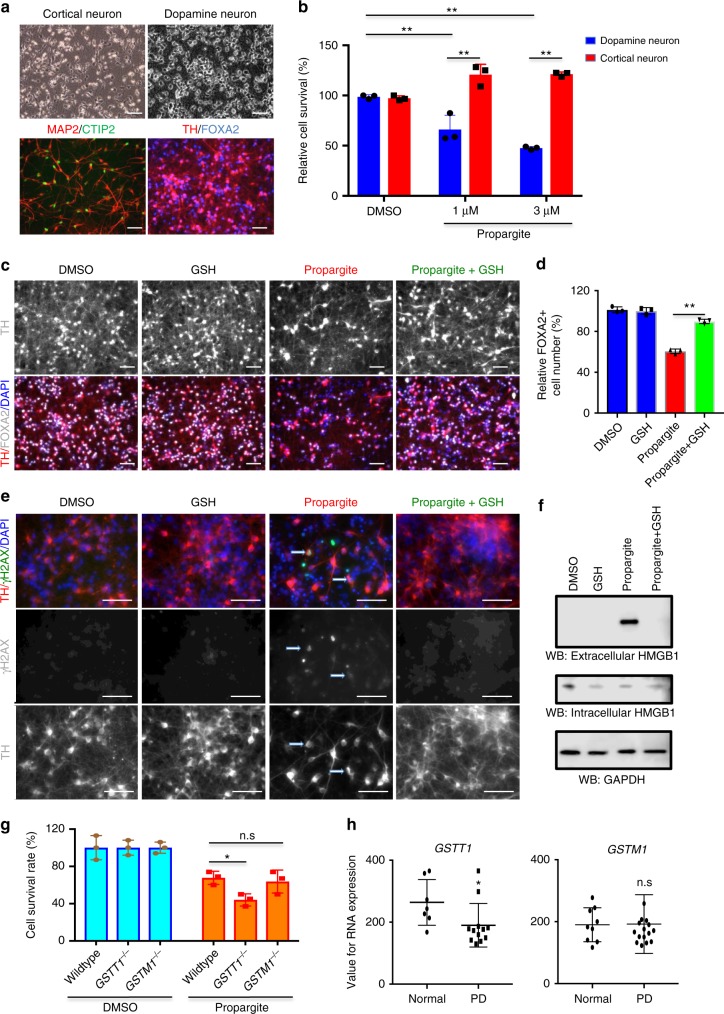
Fig. 4.
Midbrain dopamine neurons are hypersensitive to propargite-induced cell toxicity. a Characterization of cortical neuron and mDA neuron derived from H9 hESCs. Upper panel represents bright field images of cortical- and mDA-neurons. Lower panel shows cortical neurons stained for MAP2 (red) and CTIP2 (green) while mDA neurons were stained for TH (red) and FOXA2 (blue). Scale bars, 50 μm. b Relative cell survival rate of cortical- and mDA-neurons treated with DMSO or different doses of propargite. Relative cell survival was quantified by dividing propargite-treated cells to the DMSO control (n = 3). c, d Representative image (c) and relative cell survival rate (d) of mDA neurons treated with DMSO or propargite (1 μM) in the presence or absence of GSH (2 mM). mDA cells were stained for TH (red) and FOXA2 (gray), and all cells were counterstained with DAPI (blue). Scale bars, 50 μm. Relative cell survival rate was analyzed by quantification of FOXA2+ (gray) cells (n = 3). e Representative image of mDA cells treated with DMSO, DMSO+2 mM GSH, 1 μM propargite, or 1 μM propargite+2 mM GSH. White arrows indicate propargite-treated mDA cells (TH; red) co-stained with the DNA damage marker (rH2AX; green), and all cells were counterstained with DAPI (blue). Scale bars, 50 μm. f Western blotting analysis of necrosis marker (extracellular HMGB1) in DMSO or propargite (1 μM) treated mDA cells with/without GSH (2 mM). Only propargite-treated mDA cell had high extracellular HMGB1 level (n = 3). g Relative cell survival rate, quantified by the expression of FOXA2+ cells (n = 3), of mDA cells derived from isogenic wild type, GSTT1−/−, and GSTM1−/− H1 hESCs treated with DMSO and propargite (3 μM). h GSTT1, but not GSTM1 expression, in substantia nigra region of postmortem brains is significantly downregulated in Parkinson’s disease patients compared to age-matched controls. Values for RNA expression used here are from a published gene expression data and selected values except absent its detection38. Values presented as mean ± S.D. p-value was calculated by unpaired two-tailed Student’s t-test were *p < 0.05, **p < 0.01. n.s. indicates a non-significant difference. Related to Supplementary Figs. 4 and 5

