Figure 3.
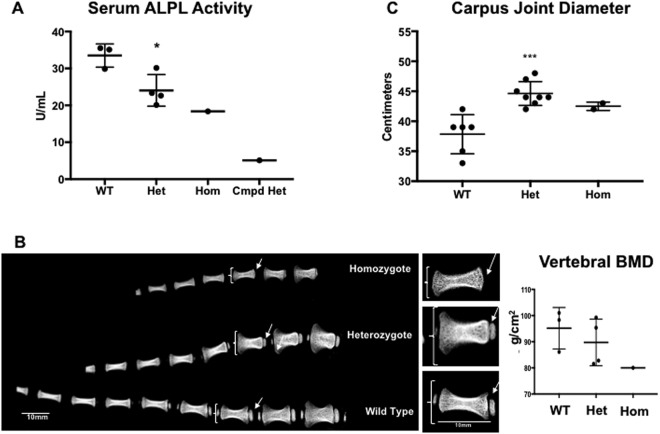
Serum Alkaline Phosphatase activity levels and tail radiographs in ALPL c.1077 C > G targeted sheep. (A) Serum alkaline phosphatase (ALPL) activity levels in units/mL. Means +/− SEM are shown. *p = 0.0120, by Student’s t-test between wild-type (WT) and heterozygous (Het) groups (n = 3 and 4, respectively). Individual values for the homozygote (Hom) and compound heterozygote (Cmpd Het) are also shown. (B) Representative tail radiographs of day 9 lambs obtained by ex vivo DXA. Brackets designate distal metaphyses; arrows designate location of secondary ossification centers. Inset magnification of individual tail vertebrae from B shows size and morphology differences in the 3 genotypes. Note different shape, size and extent of mineralization in the individual vertebrae. Vertebral BMD values for the matched distal 4 vertebrae from each group are shown. The small magnitude of difference between groups of small n was NSD by Student’s one-tailed t-test. (C) Carpus diameter measurements (2 joints per animal measured at 2 months of age) showing significant increases in heterozygous (Het) animals and increased size in homozygous (Hom), compared with wild type (WT). Means +/− SEM are shown. ***p = 0.0002, t = 4.849, df = 12 by Student’s one-tailed t-test between WT and heterozygous groups (n = 3 and 4, respectively).

