Fig. 2.

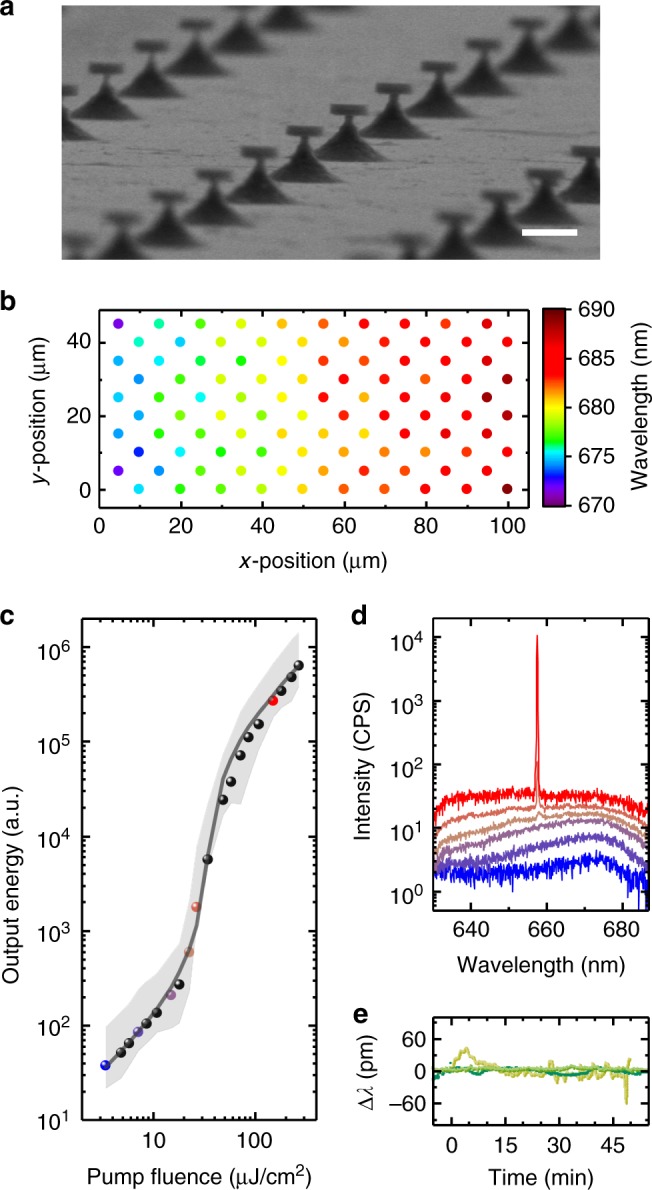
Nanodisk laser characterization. a Scanning electron microscopy image of an array of as fabricated nanodisks on struts. Scale bar, 1 µm. b Color map illustrating the lasing wavelengths for a region of 100 nanodisks on the sample from (a), showing an increase in wavelength with increasing disk diameter. c Log-log plot of light intensity emitted by detached nanodisk lasers in cell medium as a function of pump intensity. Average threshold curve for N = 10 nanodisks (symbols), min/max output energy band of same disks (gray band) and fit to the average with rate-equation model (gray line). d Emission spectra for a representative nanodisk at pump fluences corresponding with the colored symbols in (c). e, Spectral stability of lasing peak for three typical detached nanodisks in cell medium under continuous excitation at 100 Hz; intensity of pump pulses, 100 µJ cm−2
