Fig. 3.
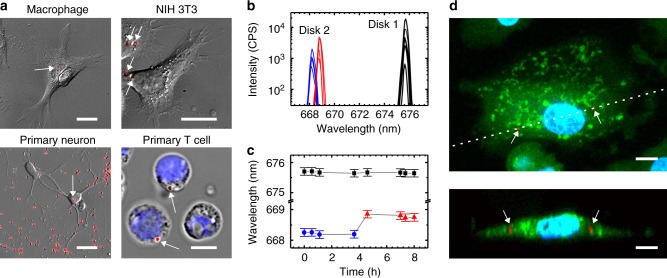
Cellular uptake and lasing from semiconductor nanodisks. a Differential interference contrast (DIC) microscopy of primary human macrophage, NIH 3T3s, primary mouse neurons and primary human T cells with internalized nanodisks (overlaid red fluorescence, indicated by white arrows). Nucleus of T cells labeled by blue Hoechst dye. b Laser spectra collected over period of 8 h for nanodisk inside a macrophage (Disk 1, black) and of a second disk that is internalized by the same cell during the experiment (Disk 2; blue before uptake, red after uptake). c Peak wavelength for spectra in (b) over time. Error bars indicate FWHM of spectra. d Laser scanning confocal fluorescence microscopy image of fixed macrophage with nanodisks (red fluorescence, indicated by white arrows), nucleus in blue (Hoechst), and cytosol in green (Calcein-AM). Maximum intensity projection (top) and vertical cross-section along the dotted line in the top panel. All scale bars, 20 µm; except for primary T cell, 5 µm

