
Fig. 4.
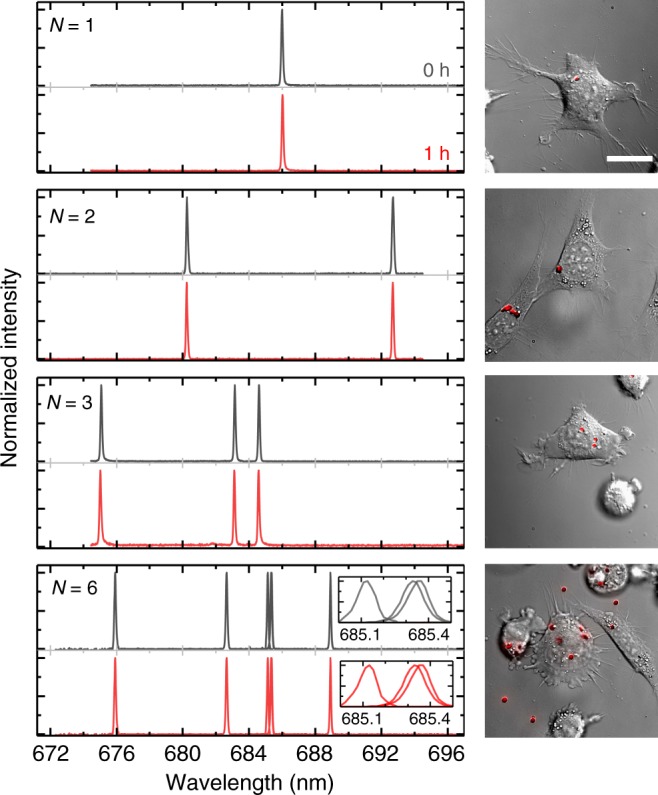
Demonstration of optical barcoding of cells with multiple nanodisk lasers. Emission spectrum from NIH 3T3 cells with N = 1, 2, 3, and 6 internalized nanodisk lasers, comparing spectra at the beginning of the experiment and after 1 h (left). DIC microscopy images of the same cells with overlaid red fluorescence from nanodisks (right). Inset for N = 6 shows spectra collected for individual excitation of three lasers with similar emission spectra. Scale bar, 20 µm