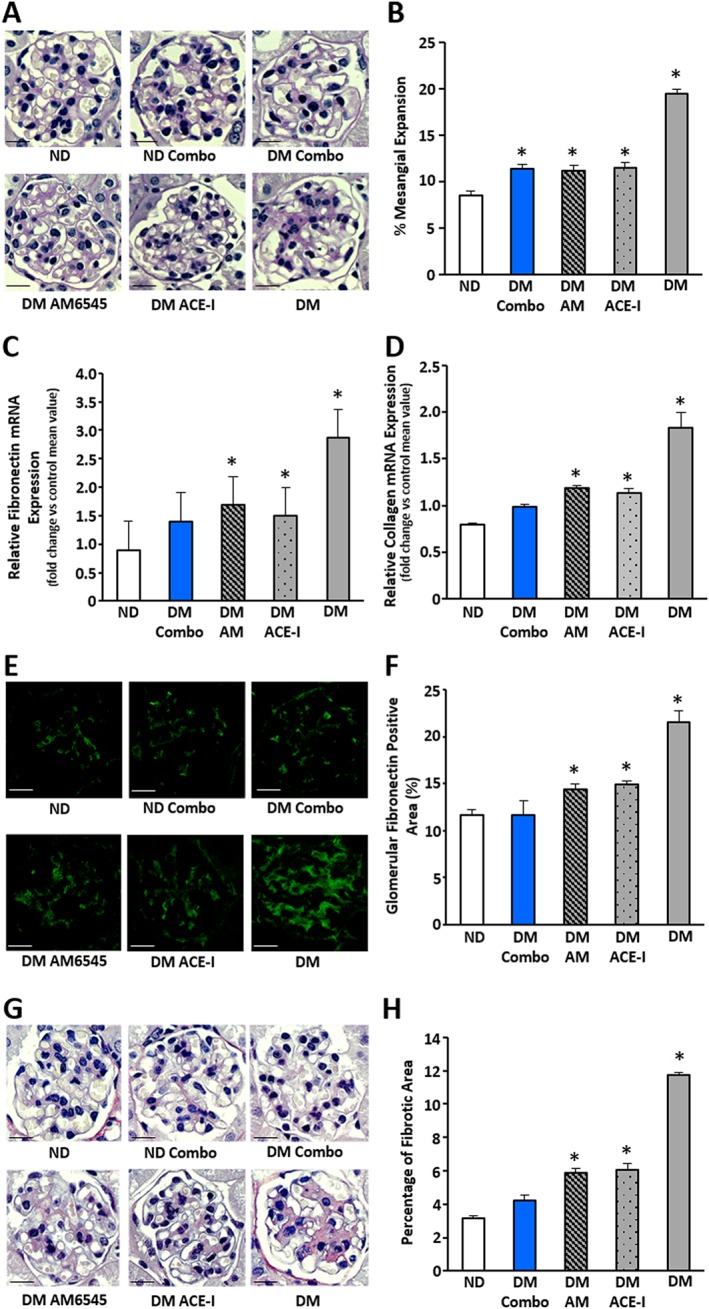
Figure 3.

Effect of AM6545 and/or perindopril on markers of fibrosis in DM. ND and DM were treated with vehicle, AM6545 (AM), perindopril (ACE‐I) or AM6545 plus perindopril (Combo) (n = 6 mice per group) for 14 weeks. PAS staining was assessed in renal cortex sections. Representative images (scale bar: 50 μm) and percentage PAS glomerular‐positive areas are shown (A, B). Both fibronectin (C) and collagen type I (D) mRNA expression was measured by real‐time PCR on total RNA extracted from the renal cortex and results are presented in the graphs. Representative images of glomerular fibronectin protein expression (E), picrosirius red staining (G) and quantitation of glomerular staining are shown (F, H) (*P < 0.05 vs. ND).
