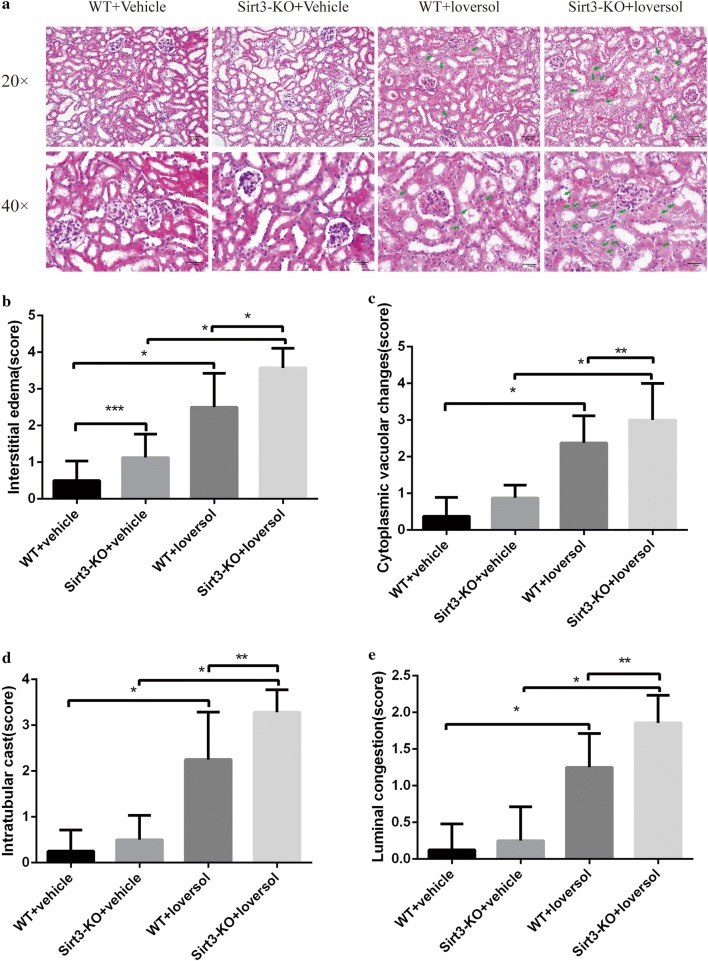
Fig. 2.
Histopathological HE staining in kidney tissues. a Representative photomicrographs of HE-stained kidney sections are presented as indicated by the green arrows. b–e Semi-quantitative analysis of interstitial edema, cytoplasmic vacuolar changes, intratubular cast formation and luminal congestion of the picture ×400. **p < 0.05, *p < 0.01, ***p > 0.05

