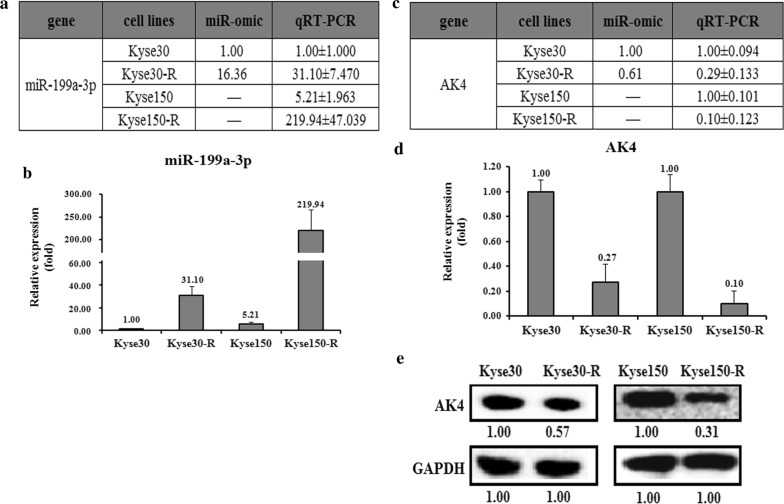
Fig. 3.
The AK4 level is lower in radiotherapy resistant strains than in parental cells. The relative miR-199a-3p level (fold) in Kyse30-R and Kyse150-R cells versus Kyse30 and Kyse150 cells measured by both miR-omic and qRT-PCR analyses is shown in a table (a) and those measured by qRT-PCR are shown in a plot (b). The relative level (fold) of the AK4 gene in Kyse30 and Kyse150 cells versus Kyse30-R and Kyse150-R cells are summarized in a table (c), with a plot showing the miR-omic and qRT-PCR analyses (d) and a figure showing the western blot analysis (e). “–” indicates no detection in the omic analysis

