Fig. 4.

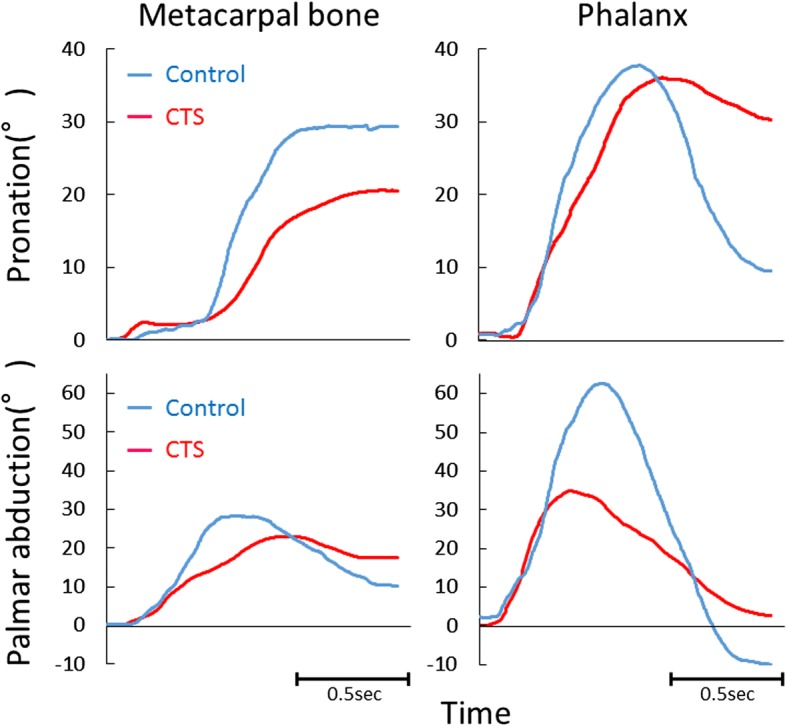
Four representative examples of transition graphs. The measured angles in the CTS (red) and control (blue) groups. Upper: pronation angle; lower: palmar abduction angle; left: metacarpal bone; right: phalanx. CTS: carpal tunnel syndrome

Four representative examples of transition graphs. The measured angles in the CTS (red) and control (blue) groups. Upper: pronation angle; lower: palmar abduction angle; left: metacarpal bone; right: phalanx. CTS: carpal tunnel syndrome