Fig. 5.
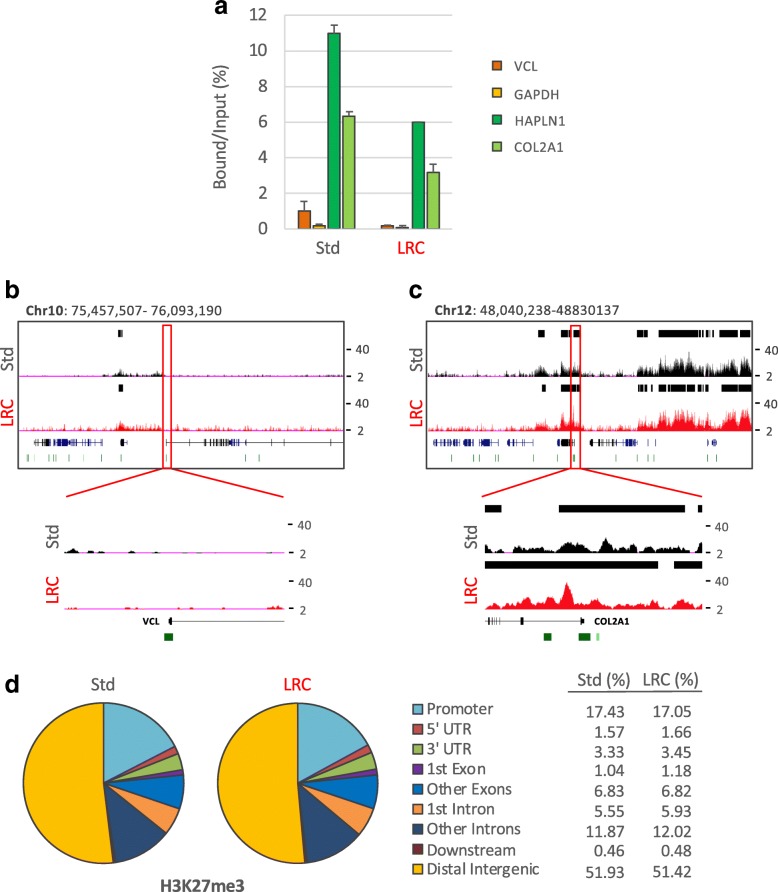
Genome-wide distribution of H3K27me3 by EPAT-ChIP. Genome-wide analysis of the archival invasive breast carcinoma sample was extended to H3K27me3 HPTM. a Transcriptionally active (VCL and GAPDH) and inactive (HAPLN1 and COL2A1) promoter regions were amplified by real-time qPCR (each sample amplified in triplicates) to evaluate the specificity of the immunoselections. Enrichment is expressed as percentage of bound DNA with respect to the input. Snapshots showing ChIP-Seq signals at promoters of the active VCL gene (b) and the silent COL2A1 gene (c) previously amplified by real-time qPCR were taken from UCSC Genome Browser. Identified peaks (black bars) are marked above the corresponding profile, CpG islands are reported as green bars, and Ref-Seq genes are indicated in blue. d Pie charts depicting the distribution of peaks across genomic features with relative percentage values shown on the right. Promoters are defined as − 3 Kb to + 3 Kb relative to the TSS, while Downstream as − 3 Kb relative to the end of 3′ UTR region

