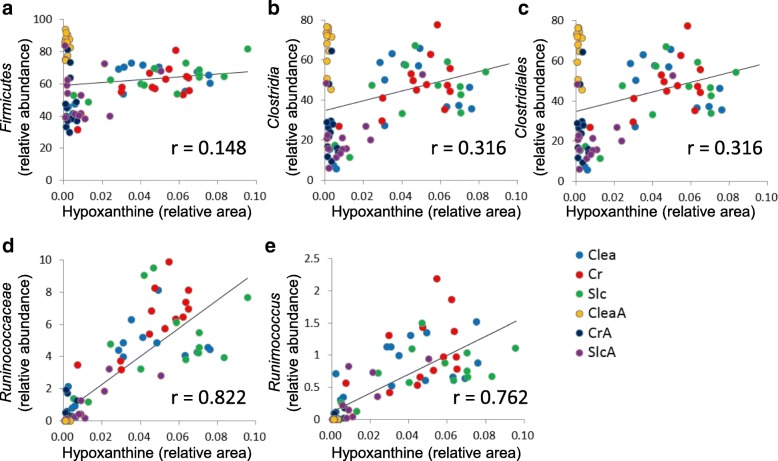
Fig. 5.
Correlation between hypoxanthine and each taxonomic classification rank. With respect to hypoxanthine, for which the principal component loading for the metabolome PC1 score was high (0.893), correlations between the relative area of hypoxanthine and the relative abundance of the genus Ruminococcus and its higher taxonomic class (family Ruminococcaceae, order Clostridiales, class Clostridia, phylum Firmicutes) were compared. The correlation coefficients at (a) phylum-, (b) class-, (c) order-, (d) family-, and (e) genus-levels were 0.148 (p = 0.20), 0.316 (p = 4.81 × 10− 3), 0.316 (p = 4.85 × 10− 3), 0.822 (p = 2.71 × 10− 20), and 0.762 (p = 5.09 × 10− 16), respectively

