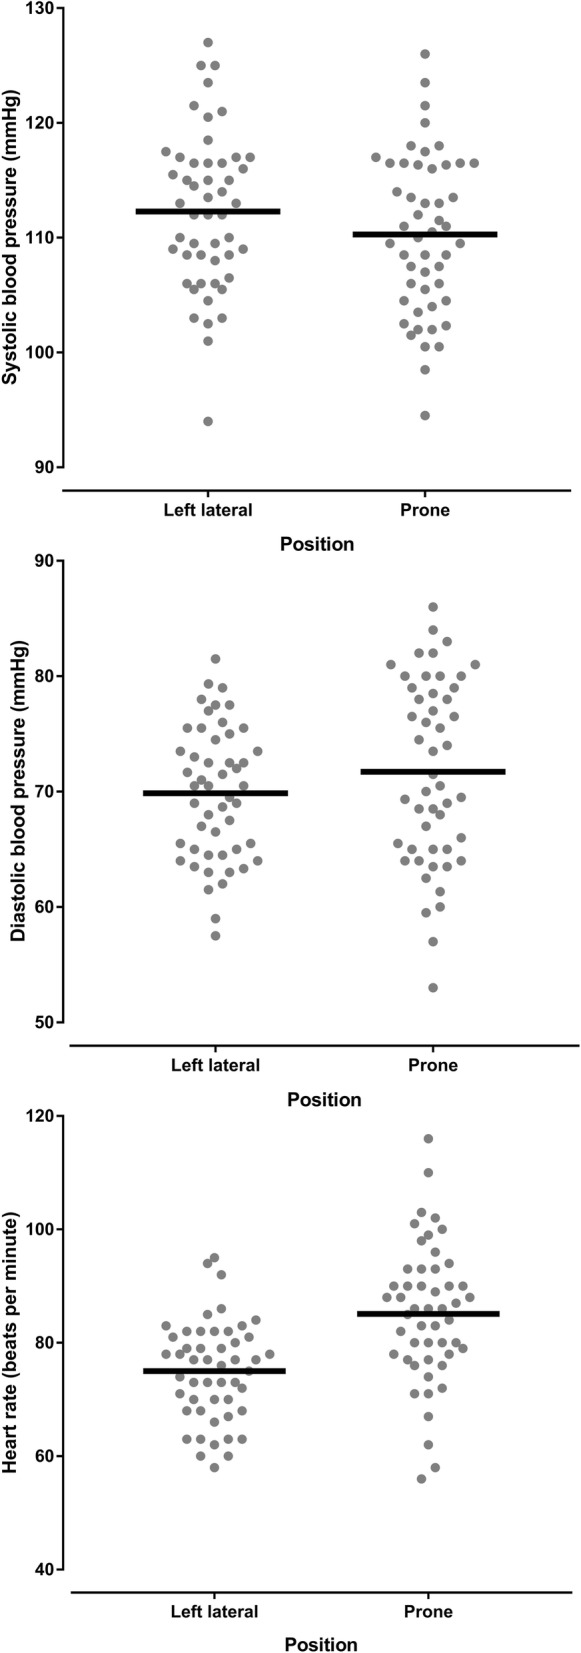
Fig. 4.

Dot plots of the systolic, diastolic and heart rate variables in healthy pregnant women in the left lateral position and the prone position. This figure shows the individual systolic, diastolic and heart rate measurements obtained from healthy pregnant women in the left lateral position and the prone position. The horizontal black lines represent the mean value
