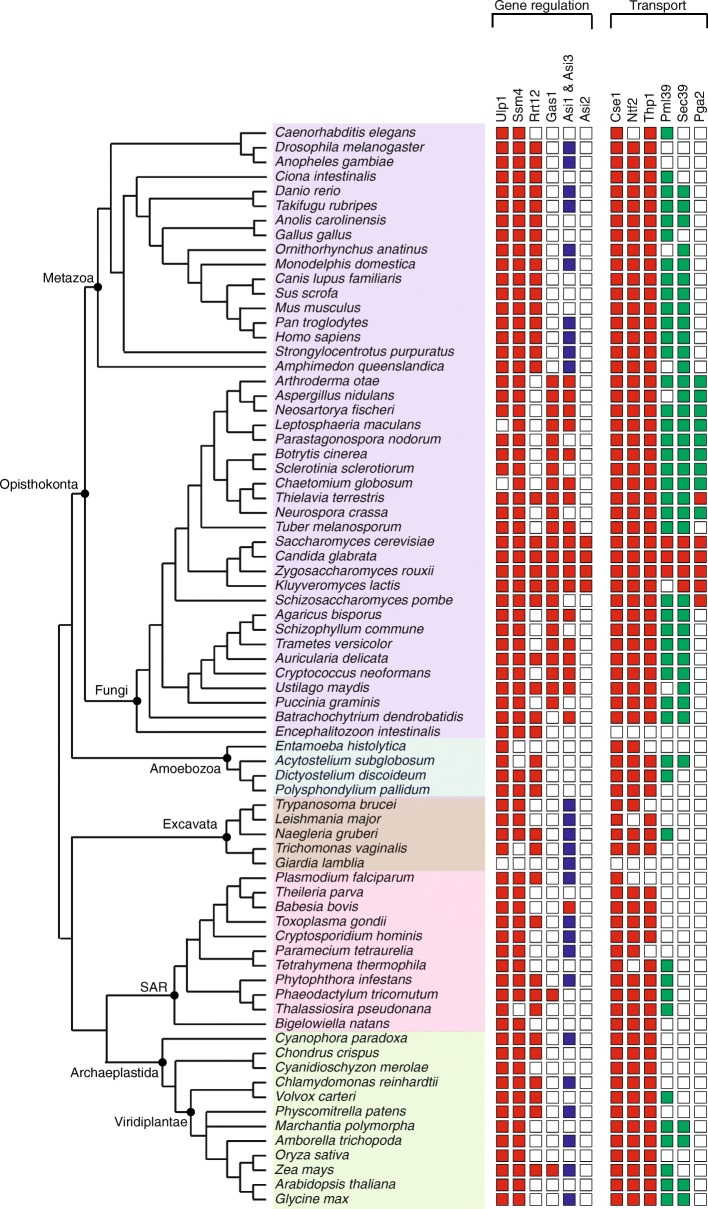
Fig. 2.
Gene regulation and transport proteins across eukaryotes. The presence/absence and the degree of conservation of homologs identified for proteins involved in gene regulation and transport are shown. Red filled rectangles represent the homologs validated using rBLAST with significant E-value (less than 10–5). Blue filled rectangles represent the homologs validated using rBLAST but with E-value higher than 10–5 but less than 10− 2. The green filled rectangles represent the homologs that can be found only using hmmsearch and share conserved region/domain. The supergroups Opisthokonta, Ameobozoa, Excavata, SAR and Archaeplastida are shaded in purple, blue, brown, pink and green filled rectangles, respectively

