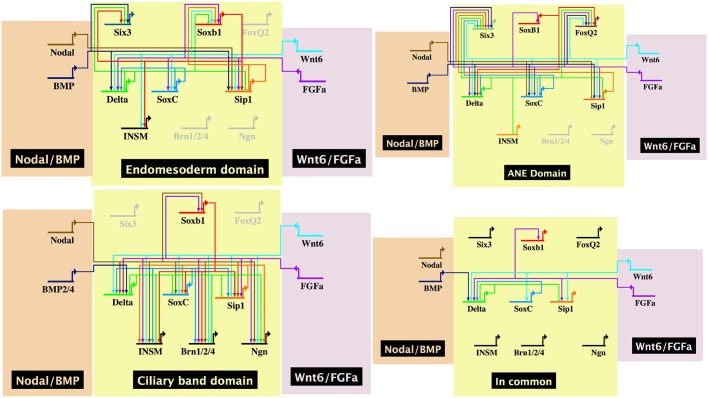
Fig. 6.
GRN models in BioTapestry of each proneural domain and a model reflecting ‘in common’ connections. Data were drawn from perturbations shown in Figs 1,3-5 and Fig. S5. In each case, inputs could be direct or indirect. The ‘In Common’ model shows all connections that are common to specification in all three territories.

