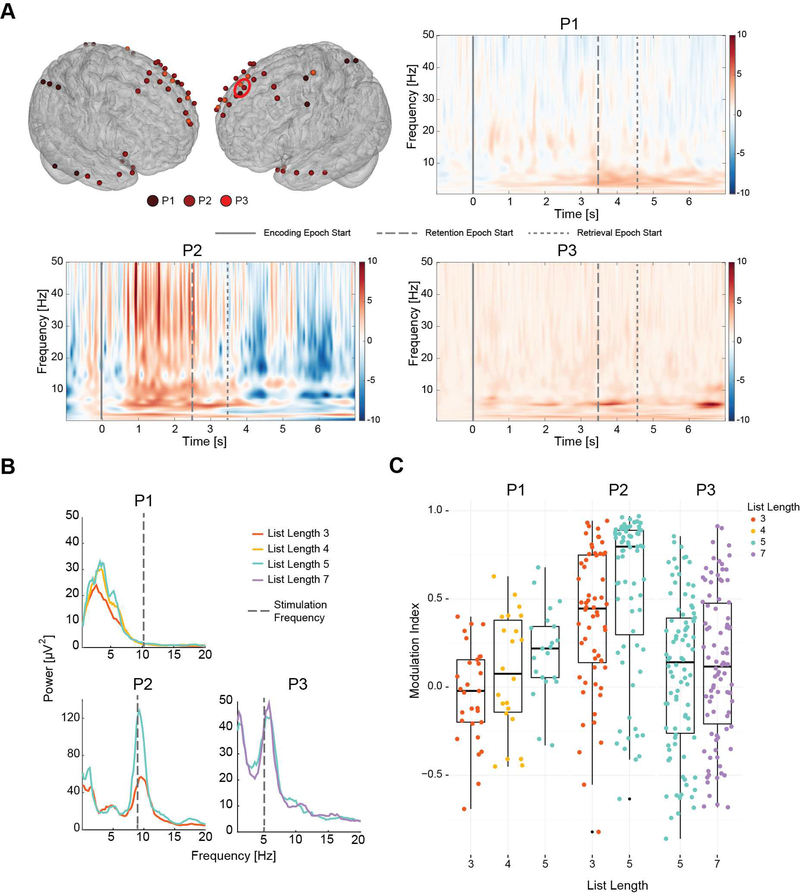
Figure 2.
(A) Cortical model showing electrodes that exhibited task-related modulation. Red circle denotes the three electrodes in lSFG whose event related spectral perturbation are plotted. observed in left superior frontal gyrus electrodes during sham trials for P1 and baseline session trials for P2 and P3 indicating the modulation of signal in the band 3 – 12 Hz. Hot (red) colors indicate an increase and cold (blue) colors indicate a decrease in signal power relative to baseline. (B) Power spectral density of lSFG electrodes during baseline session in encoding epoch showing peaks that were used to determine stimulation frequency (dotted gray lines) in P2 and P3. (C) Modulation indices during encoding epoch across all lSFG electrodes that exhibited significant task related modulation of signal power. In P1 and P2 there was a significant difference between modulation indices for list length 3 and list length 5.

