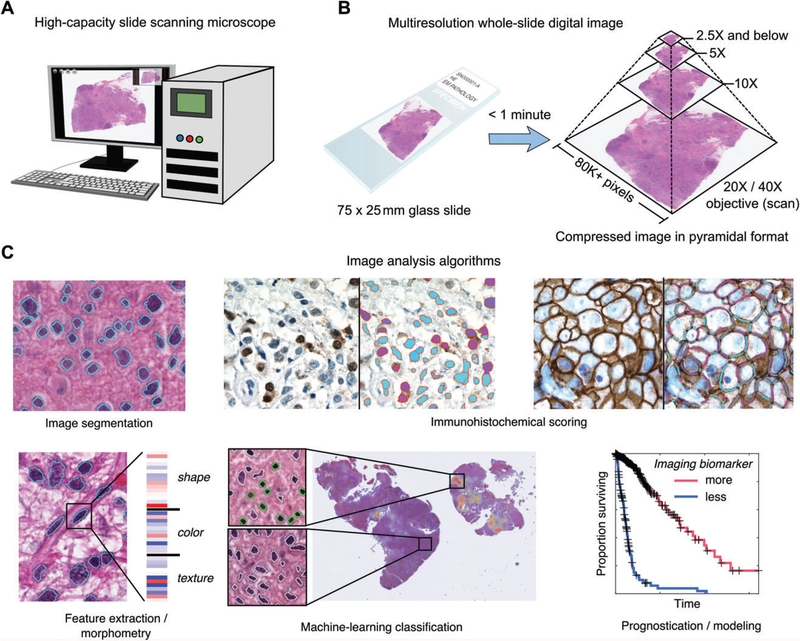
Figure 3.
Whole slide imaging and image analysis. (A) Slide-scanning microscopes can rapidly digitize an entire glass slide, producing a ‘whole slide’ digital image. These devices can scan large batches of slides, producing >1000 scans in a single day. (B) Slides are digitized with a × 20 or ×40 objective, and this base magnification is used by the scanner software to produce a multiresolution image pyramid containing downsampled magnifications. This pyramidal format enables smooth zooming and interaction with the image, and provides additional resolutions for image analysis. (C) A large number of image analysis algorithms exist for analysing whole slide images (from left to right, top to bottom): image segmentation algorithms are used to automatically delineate the boundaries of structures such as cell nuclei; immunohistochemical scoring algorithms can be used to measure the subcellular localization and intensity of antigens; feature extraction can be used to calculate quantitative features describing the shape, colour and texture of tissue elements; machine-learning algorithms can be used with imaging features to classify objects – here, a classifier was trained to identify mononuclear cells (green) in a glioma, and a heatmap indicating the concentration of positively classified cells in the slide is shown; measurements made by image analysis can be used to build prognostic models that can objectively discriminate patient outcomes.

