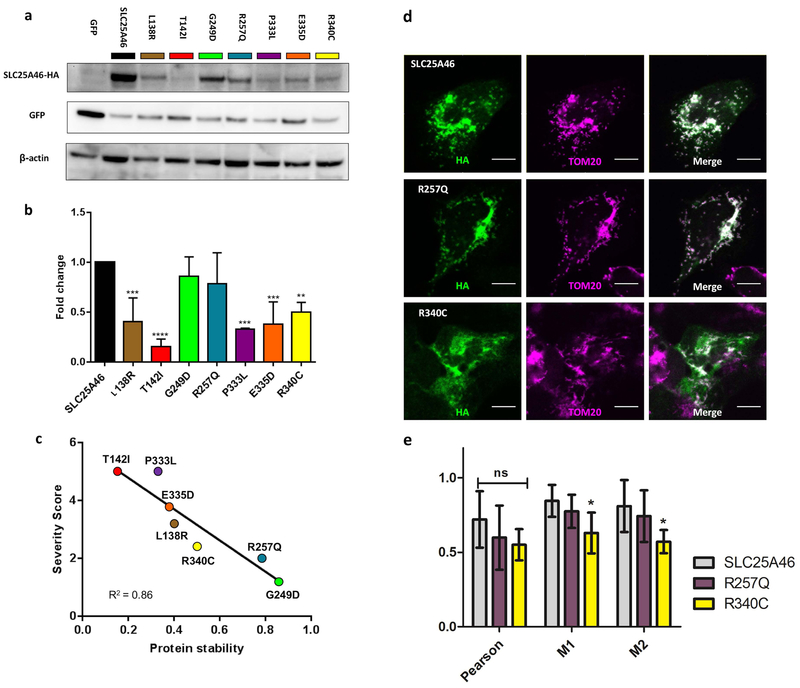
Figure 3. Correlation of protein levels, severity of patient symptoms, and mitochondrial targeting of the SLC25A46 substitution variants.
(a) Representative Western blot of transiently transfected HEK293T cells with SLC25A46-HA mutations and GFP. Blots were probed against HA, GFP, and β-actin. The HA signal was normalized to GFP to control for the transfection efficiency. (b) Histogram shows the mean ± SD from three independent experiments, the relative protein levels of the mutations were normalized to SLC25A46 WT for each experiment. All of the mutations are significantly reduced in comparison to wildtype SLC25A46 with the exception of p.R257Q and p.G249D which were trending but not significant. (c) Correlation plot between the clinical severity scores from (Table 2) and the average relative protein levels determined by the Western blots. (d) Colocalization of wildtype SLC25A46, p.R257Q, and p.R340C with the mitochondria outer membrane marker TOM20 in U2OS cells. Wildtype and p.R257Q colocalize strongly with TOM20, while p.R340C shows less colocalization with the mitochondria. Scale bar 10 μm. (e) Quantification of three measures of colocalization; Pearson, Meanders 1 (M1), and Meanders 2 (M2). Significance was determined by a 2-way ANOVA with Bonferroni posttest with 6 cells per condition.

