Figure 2.

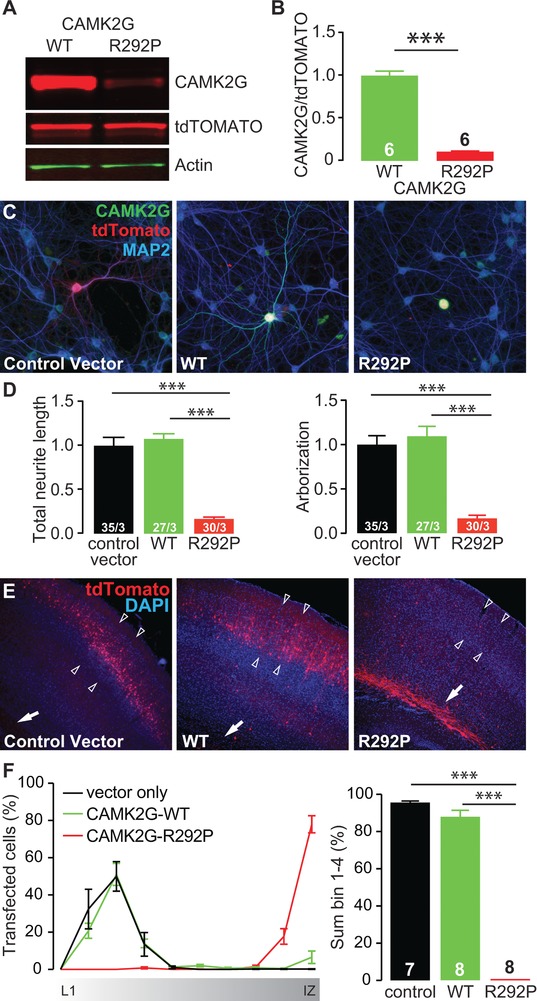
CAMK2GArg292Pro overexpression is severely disruptive for neurons in vitro and in vivo. (A) Representative western blot of CAMK2GWT or CAMK2GArg292Pro (R292P) transfected HEK‐293T cells. (B) Quantification of the levels of CAMK2G expression, normalized against tdTOMATO in the different conditions (CAMK2GWT vs. CAMK2GArg292Pro: t[10] = 16.62, P = 1.30E‐08, two‐tailed unpaired t‐test). (C) Representative confocal images of hippocampal neurons transfected on DIV7 with control vector (lacking CAMK2G), CAMK2GWT or CAMK2GArg292Pro. See also Supplement 1 related to Figure 2. Transfected neurons are identified by the tdTOMATO (red). (D) Summary bar graphs of total neurite length and arborization measured for each condition and normalized to the control vector (total neurite length: one‐way ANOVA F[2,89] = 49.35, P = 3.79E‐15; control vector vs. CAMK2GWT, P = 0.9; CAMK2GArg292Pro, P = 0.0001; CAMK2GArg292Pro vs. CAMK2GWT, P = 0.0001; arborization: one‐way ANOVA F[2,89] = 31.8, P = 3.80E‐11; control vector vs. CAMK2GWT, P = 0.9; CAMK2GArg292Pro, P = 0.0001; CAMK2GArg292Pro vs. CAMK2GWT, P = 0.0001). (E) Representative images of P20‐P22 pups in utero electroporated at E14.5 with control vector, CAMK2GWT or CAMK2GArg292Pro tdTOMATO positive cells indicate the successfully targeted neurons. DAPI (blue) counterstaining is used to identify general cortical structure. (F) Left: quantification of the neuronal migration pattern from the Layer 1 (L1) to the intermediate zone (IZ); Right: analysis of the percentage of targeted cells that reach the outer layers of the cortex measured as sum of bin 1–4 (one‐way ANOVA, F[2,20] = 58.88, P = 4.16E‐09; control vector vs. CAMK2GWT, P = 0.07; CAMK2GArg292Pro, P = 0.0001; CAMK2GWT vs. CAMK2GArg292Pro, P = 0.0001). Arrowheads indicate layer 2/3 of the somatosensory cortex, whereas the arrow indicates the subventricular zone (SVZ). Data in (B), (D), and (F) are presented as mean ± SEM. Numbers (X/Y) depicted in the bar graphs represent the number of samples (B), the total number of cells (X) and number of independent cultures (Y) (D) or the number of pictures (F) analyzed
