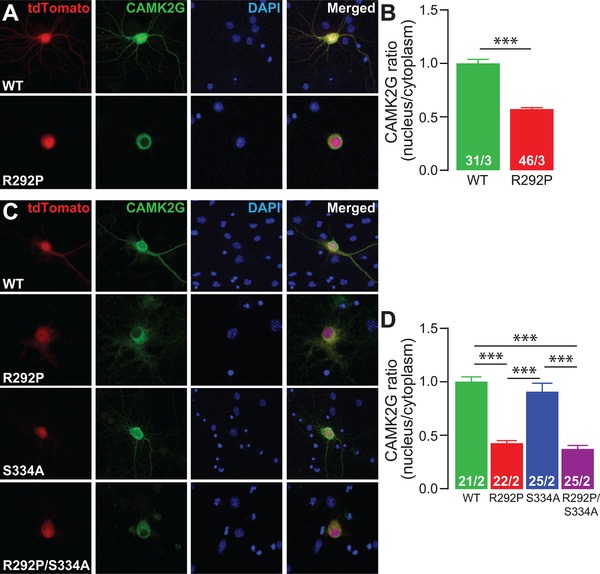
Figure 5.

The CAMK2G‐NLSArg292Pro mutation interferes with nuclear translocation of CAMK2G‐NLS. (A and C) Representative confocal images of hippocampal (A) or cortical (C) neurons transfected on DIV7 with CAMK2G‐NLSWT, CAMK2G‐NLSArg292Pro (R292P), CAMK2G‐NLSSer334Ala (S224A), or CAMK2G‐NLSArg292Pro/Ser334Ala (R292P/S334A). Transfected neurons are identified by the tdTOMATO (red). (B and D) Summary bar graphs of CAMK2G expression level measured as a ratio nucleus vs. cytoplasm and normalized to the WT level. (B: CAMK2GWT vs. CAMK2GArg292Pro, P = 6.81E‐19, t(75) = 11.87, two‐tailed unpaired t‐test; D: one‐way ANOVA, F[3,86] = 43.58, P = 3.19E‐17; CAMK2G‐NLSWT vs. CAMK2G‐NLSArg292Pro, P = 0.0001; CAMK2G‐NLSSer334Ala, P = 0.99; CAMK2G‐NLSArg292Pro/Ser334Ala, P = 0.0001; CAMK2GArg292Pro vs. CAMK2G‐NLSSer334Ala, P = 0.0001; CAMK2G‐NLSArg292Pro/Ser334Ala, P = 0.99; CAMK2G‐NLSSer334Ala vs. CAMK2G‐NLSArg292Pro/Ser334Ala, P = 0.0001). Data are presented as mean ± SEM. Numbers (X/Y) depicted in the bar graphs represent the total number of cells (X) and number of independent cultures (Y) analyzed
